In vector calculus, the gradient of a scalar-valued differentiable function of several variables is the vector field whose value at a point gives the direction and the rate of fastest increase. The gradient transforms like a vector under change of basis of the space of variables of . If the gradient of a function is non-zero at a point , the direction of the gradient is the direction in which the function increases most quickly from , and the magnitude of the gradient is the rate of increase in that direction, the greatest absolute directional derivative. Further, a point where the gradient is the zero vector is known as a stationary point. The gradient thus plays a fundamental role in optimization theory, where it is used to minimize a function by gradient descent. In coordinate-free terms, the gradient of a function may be defined by:

In probability theory and statistics, the multivariate normal distribution, multivariate Gaussian distribution, or joint normal distribution is a generalization of the one-dimensional (univariate) normal distribution to higher dimensions. One definition is that a random vector is said to be k-variate normally distributed if every linear combination of its k components has a univariate normal distribution. Its importance derives mainly from the multivariate central limit theorem. The multivariate normal distribution is often used to describe, at least approximately, any set of (possibly) correlated real-valued random variables, each of which clusters around a mean value.
In machine learning, support vector machines are supervised max-margin models with associated learning algorithms that analyze data for classification and regression analysis. Developed at AT&T Bell Laboratories, SVMs are one of the most studied models, being based on statistical learning frameworks of VC theory proposed by Vapnik and Chervonenkis (1974).

Principal component analysis (PCA) is a linear dimensionality reduction technique with applications in exploratory data analysis, visualization and data preprocessing.
In statistics, the mean squared error (MSE) or mean squared deviation (MSD) of an estimator measures the average of the squares of the errors—that is, the average squared difference between the estimated values and the actual value. MSE is a risk function, corresponding to the expected value of the squared error loss. The fact that MSE is almost always strictly positive is because of randomness or because the estimator does not account for information that could produce a more accurate estimate. In machine learning, specifically empirical risk minimization, MSE may refer to the empirical risk, as an estimate of the true MSE.
Forecasting is the process of making predictions based on past and present data. Later these can be compared with what actually happens. For example, a company might estimate their revenue in the next year, then compare it against the actual results creating a variance actual analysis. Prediction is a similar but more general term. Forecasting might refer to specific formal statistical methods employing time series, cross-sectional or longitudinal data, or alternatively to less formal judgmental methods or the process of prediction and assessment of its accuracy. Usage can vary between areas of application: for example, in hydrology the terms "forecast" and "forecasting" are sometimes reserved for estimates of values at certain specific future times, while the term "prediction" is used for more general estimates, such as the number of times floods will occur over a long period.
In probability theory and statistics, a Gaussian process is a stochastic process, such that every finite collection of those random variables has a multivariate normal distribution. The distribution of a Gaussian process is the joint distribution of all those random variables, and as such, it is a distribution over functions with a continuous domain, e.g. time or space.

In mathematical optimization and decision theory, a loss function or cost function is a function that maps an event or values of one or more variables onto a real number intuitively representing some "cost" associated with the event. An optimization problem seeks to minimize a loss function. An objective function is either a loss function or its opposite, in which case it is to be maximized. The loss function could include terms from several levels of the hierarchy.

In statistics, originally in geostatistics, kriging or Kriging, also known as Gaussian process regression, is a method of interpolation based on Gaussian process governed by prior covariances. Under suitable assumptions of the prior, kriging gives the best linear unbiased prediction (BLUP) at unsampled locations. Interpolating methods based on other criteria such as smoothness may not yield the BLUP. The method is widely used in the domain of spatial analysis and computer experiments. The technique is also known as Wiener–Kolmogorov prediction, after Norbert Wiener and Andrey Kolmogorov.

In mathematics, the sign function or signum function is a function that has the value −1, +1 or 0 according to whether the sign of a given real number is positive or negative, or the given number is itself zero. In mathematical notation the sign function is often represented as or .
In statistics, a generalized linear model (GLM) is a flexible generalization of ordinary linear regression. The GLM generalizes linear regression by allowing the linear model to be related to the response variable via a link function and by allowing the magnitude of the variance of each measurement to be a function of its predicted value.

The Gauss–Newton algorithm is used to solve non-linear least squares problems, which is equivalent to minimizing a sum of squared function values. It is an extension of Newton's method for finding a minimum of a non-linear function. Since a sum of squares must be nonnegative, the algorithm can be viewed as using Newton's method to iteratively approximate zeroes of the components of the sum, and thus minimizing the sum. In this sense, the algorithm is also an effective method for solving overdetermined systems of equations. It has the advantage that second derivatives, which can be challenging to compute, are not required.
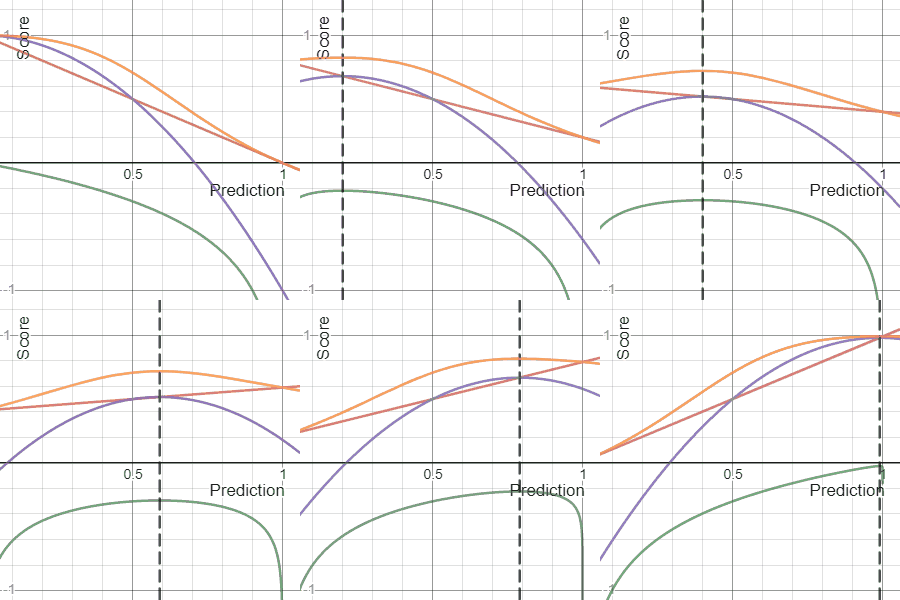
The Brier score is a strictly proper scoring rule that measures the accuracy of probabilistic predictions. For unidimensional predictions, it is strictly equivalent to the mean squared error as applied to predicted probabilities.
The mean absolute percentage error (MAPE), also known as mean absolute percentage deviation (MAPD), is a measure of prediction accuracy of a forecasting method in statistics. It usually expresses the accuracy as a ratio defined by the formula:

In decision theory, a scoring rule provides evaluation metrics for probabilistic predictions or forecasts. While "regular" loss functions assign a goodness-of-fit score to a predicted value and an observed value, scoring rules assign such a score to a predicted probability distribution and an observed value. On the other hand, a scoring function provides a summary measure for the evaluation of point predictions, i.e. one predicts a property or functional , like the expectation or the median.

In mathematics, the sign of a real number is its property of being either positive, negative, or 0. Depending on local conventions, zero may be considered as having its own unique sign, having no sign, or having both positive and negative sign. In some contexts, it makes sense to distinguish between a positive and a negative zero.
The root mean square deviation (RMSD) or root mean square error (RMSE) is either one of two closely related and frequently used measures of the differences between true or predicted values on the one hand and observed values or an estimator on the other. The deviation is typically simply a differences of scalars; it can also be generalized to the vector lengths of a displacement, as in the bioinformatics concept of root mean square deviation of atomic positions.

In pattern recognition, information retrieval, object detection and classification, precision and recall are performance metrics that apply to data retrieved from a collection, corpus or sample space.
In probability theory and directional statistics, a wrapped Lévy distribution is a wrapped probability distribution that results from the "wrapping" of the Lévy distribution around the unit circle.
In machine learning, the kernel perceptron is a variant of the popular perceptron learning algorithm that can learn kernel machines, i.e. non-linear classifiers that employ a kernel function to compute the similarity of unseen samples to training samples. The algorithm was invented in 1964, making it the first kernel classification learner.


