F-score

Last updated
Precision and recall Precisionrecall.svg
Precision and recall

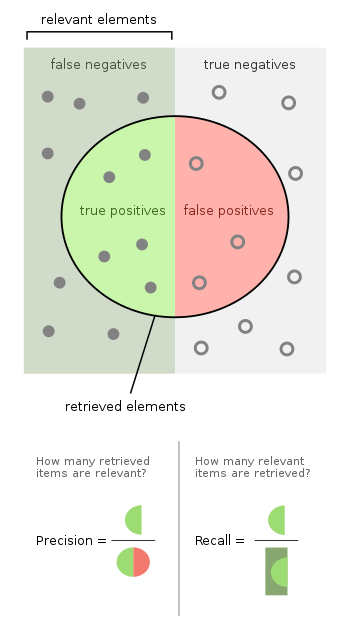
In statistical analysis of binary classification and information retrieval systems, the F-score or F-measure is a measure of predictive performance. It is calculated from the precision and recall of the test, where the precision is the number of true positive results divided by the number of all samples predicted to be positive, including those not identified correctly, and the recall is the number of true positive results divided by the number of all samples that should have been identified as positive. Precision is also known as positive predictive value, and recall is also known as sensitivity in diagnostic binary classification.

Contents

The F1 score is the harmonic mean of the precision and recall. It thus symmetrically represents both precision and recall in one metric. The more generic score applies additional weights, valuing one of precision or recall more than the other.

The highest possible value of an F-score is 1.0, indicating perfect precision and recall, and the lowest possible value is 0, if either precision or recall are zero.

Etymology

The name F-measure is believed to be named after a different F function in Van Rijsbergen's book, when introduced to the Fourth Message Understanding Conference (MUC-4, 1992). [1]

Definition

The traditional F-measure or balanced F-score (F1 score) is the harmonic mean of precision and recall: [2]

.

Fβ score

A more general F score, , that uses a positive real factor , where is chosen such that recall is considered times as important as precision, is:

.

In terms of Type I and type II errors this becomes:

.

Two commonly used values for are 2, which weighs recall higher than precision, and 0.5, which weighs recall lower than precision.

The F-measure was derived so that "measures the effectiveness of retrieval with respect to a user who attaches times as much importance to recall as precision". [3] It is based on Van Rijsbergen's effectiveness measure

.

Their relationship is where .

Diagnostic testing

This is related to the field of binary classification where recall is often termed "sensitivity".

Predicted conditionSources: [4] [5] [6] [7] [8] [9] [10] [11] [12]
Total population
= P + N
Predicted Positive (PP)Predicted Negative (PN) Informedness, bookmaker informedness (BM)
= TPR + TNR − 1
Prevalence threshold (PT)
= TPR × FPR - FPR/TPR - FPR
Actual condition
Positive (P) [lower-alpha 1] True positive (TP),
hit [lower-alpha 2]
False negative (FN),
miss, underestimation
True positive rate (TPR), recall, sensitivity (SEN), probability of detection, hit rate, power
= TP/P= 1 − FNR
False negative rate (FNR),
miss rate
type II error [lower-alpha 3]
= FN/P= 1 − TPR
Negative (N) [lower-alpha 4] False positive (FP),
false alarm, overestimation
True negative (TN),
correct rejection [lower-alpha 5]
False positive rate (FPR),
probability of false alarm, fall-out
type I error [lower-alpha 6]
= FP/N= 1 − TNR
True negative rate (TNR),
specificity (SPC), selectivity
= TN/N= 1 − FPR
Prevalence
= P/P + N
Positive predictive value (PPV), precision
= TP/PP= 1 − FDR
False omission rate (FOR)
= FN/PN= 1 − NPV
Positive likelihood ratio (LR+)
= TPR/FPR
Negative likelihood ratio (LR−)
= FNR/TNR
Accuracy (ACC)
= TP + TN/P + N
False discovery rate (FDR)
= FP/PP= 1 − PPV
Negative predictive value (NPV)
= TN/PN= 1 − FOR
Markedness (MK), deltaP (Δp)
= PPV + NPV − 1
Diagnostic odds ratio (DOR)
= LR+/LR−
Balanced accuracy (BA)
= TPR + TNR/2
F1 score
= 2 PPV × TPR/PPV + TPR= 2 TP/2 TP + FP + FN
Fowlkes–Mallows index (FM)
= PPV × TPR
Matthews correlation coefficient (MCC)
= TPR × TNR × PPV × NPV- FNR × FPR × FOR × FDR
Threat score (TS), critical success index (CSI), Jaccard index
= TP/TP + FN + FP
  1. the number of real positive cases in the data
  2. A test result that correctly indicates the presence of a condition or characteristic
  3. Type II error: A test result which wrongly indicates that a particular condition or attribute is absent
  4. the number of real negative cases in the data
  5. A test result that correctly indicates the absence of a condition or characteristic
  6. Type I error: A test result which wrongly indicates that a particular condition or attribute is present
Normalised harmonic mean plot where x is precision, y is recall and the vertical axis is F1 score, in percentage points Harmonic mean 3D plot from 0 to 100.png
Normalised harmonic mean plot where x is precision, y is recall and the vertical axis is F1 score, in percentage points
Precision-Recall Curve: points from different thresholds are color coded, the point with optimal F-score is highlighted in red PR curve with optimal fscore.png
Precision-Recall Curve: points from different thresholds are color coded, the point with optimal F-score is highlighted in red

Dependence of the F-score on class imbalance

Precision-recall curve, and thus the score, explicitly depends on the ratio of positive to negative test cases. [13] This means that comparison of the F-score across different problems with differing class ratios is problematic. One way to address this issue (see e.g., Siblini et al, 2020 [14] ) is to use a standard class ratio when making such comparisons.

Applications

The F-score is often used in the field of information retrieval for measuring search, document classification, and query classification performance. [15] It is particularly relevant in applications which are primarily concerned with the positive class and where the positive class is rare relative to the negative class.

Earlier works focused primarily on the F1 score, but with the proliferation of large scale search engines, performance goals changed to place more emphasis on either precision or recall [16] and so is seen in wide application.

The F-score is also used in machine learning. [17] However, the F-measures do not take true negatives into account, hence measures such as the Matthews correlation coefficient, Informedness or Cohen's kappa may be preferred to assess the performance of a binary classifier. [18]

The F-score has been widely used in the natural language processing literature, [19] such as in the evaluation of named entity recognition and word segmentation.

Properties

The F1 score is the Dice coefficient of the set of retrieved items and the set of relevant items. [20]

Criticism

David Hand and others criticize the widespread use of the F1 score since it gives equal importance to precision and recall. In practice, different types of mis-classifications incur different costs. In other words, the relative importance of precision and recall is an aspect of the problem. [23]

According to Davide Chicco and Giuseppe Jurman, the F1 score is less truthful and informative than the Matthews correlation coefficient (MCC) in binary evaluation classification. [24]

David M W Powers has pointed out that F1 ignores the True Negatives and thus is misleading for unbalanced classes, while kappa and correlation measures are symmetric and assess both directions of predictability - the classifier predicting the true class and the true class predicting the classifier prediction, proposing separate multiclass measures Informedness and Markedness for the two directions, noting that their geometric mean is correlation. [25]

Another source of critique of F1 is its lack of symmetry. It means it may change its value when dataset labeling is changed - the "positive" samples are named "negative" and vice versa. This criticism is met by the P4 metric definition, which is sometimes indicated as a symmetrical extension of F1. [26]

Difference from Fowlkes–Mallows index

While the F-measure is the harmonic mean of recall and precision, the Fowlkes–Mallows index is their geometric mean. [27]

Extension to multi-class classification

The F-score is also used for evaluating classification problems with more than two classes (Multiclass classification). In this setup, the final score is obtained by micro-averaging (biased by class frequency) or macro-averaging (taking all classes as equally important). For macro-averaging, two different formulas have been used by applicants: the F-score of (arithmetic) class-wise precision and recall means or the arithmetic mean of class-wise F-scores, where the latter exhibits more desirable properties. [28]

See also

Related Research Articles

<span class="mw-page-title-main">Logistic regression</span> Statistical model for a binary dependent variable

In statistics, the logistic model is a statistical model that models the log-odds of an event as a linear combination of one or more independent variables. In regression analysis, logistic regression is estimating the parameters of a logistic model. Formally, in binary logistic regression there is a single binary dependent variable, coded by an indicator variable, where the two values are labeled "0" and "1", while the independent variables can each be a binary variable or a continuous variable. The corresponding probability of the value labeled "1" can vary between 0 and 1, hence the labeling; the function that converts log-odds to probability is the logistic function, hence the name. The unit of measurement for the log-odds scale is called a logit, from logistic unit, hence the alternative names. See § Background and § Definition for formal mathematics, and § Example for a worked example.

<span class="mw-page-title-main">Onsager reciprocal relations</span> Relations between flows and forces, or gradients, in thermodynamic systems

In thermodynamics, the Onsager reciprocal relations express the equality of certain ratios between flows and forces in thermodynamic systems out of equilibrium, but where a notion of local equilibrium exists.

<span class="mw-page-title-main">Cluster analysis</span> Grouping a set of objects by similarity

Cluster analysis or clustering is the task of grouping a set of objects in such a way that objects in the same group are more similar to each other than to those in other groups (clusters). It is a main task of exploratory data analysis, and a common technique for statistical data analysis, used in many fields, including pattern recognition, image analysis, information retrieval, bioinformatics, data compression, computer graphics and machine learning.

Quantum statistical mechanics is statistical mechanics applied to quantum mechanical systems. In quantum mechanics a statistical ensemble is described by a density operator S, which is a non-negative, self-adjoint, trace-class operator of trace 1 on the Hilbert space H describing the quantum system. This can be shown under various mathematical formalisms for quantum mechanics.

In the field of machine learning and specifically the problem of statistical classification, a confusion matrix, also known as error matrix, is a specific table layout that allows visualization of the performance of an algorithm, typically a supervised learning one; in unsupervised learning it is usually called a matching matrix.

In thermodynamics, an activity coefficient is a factor used to account for deviation of a mixture of chemical substances from ideal behaviour. In an ideal mixture, the microscopic interactions between each pair of chemical species are the same and, as a result, properties of the mixtures can be expressed directly in terms of simple concentrations or partial pressures of the substances present e.g. Raoult's law. Deviations from ideality are accommodated by modifying the concentration by an activity coefficient. Analogously, expressions involving gases can be adjusted for non-ideality by scaling partial pressures by a fugacity coefficient.

The Green–Kubo relations give the exact mathematical expression for a transport coefficient in terms of the integral of the equilibrium time correlation function of the time derivative of a corresponding microscopic variable :

In thermodynamics, the heat transfer coefficient or film coefficient, or film effectiveness, is the proportionality constant between the heat flux and the thermodynamic driving force for the flow of heat. It is used in calculating the heat transfer, typically by convection or phase transition between a fluid and a solid. The heat transfer coefficient has SI units in watts per square meter per kelvin (W/m²K).

<span class="mw-page-title-main">Coefficient of determination</span> Indicator for how well data points fit a line or curve

In statistics, the coefficient of determination, denoted R2 or r2 and pronounced "R squared", is the proportion of the variation in the dependent variable that is predictable from the independent variable(s).

In statistics, ordinary least squares (OLS) is a type of linear least squares method for choosing the unknown parameters in a linear regression model by the principle of least squares: minimizing the sum of the squares of the differences between the observed dependent variable in the input dataset and the output of the (linear) function of the independent variable.

In statistics, multinomial logistic regression is a classification method that generalizes logistic regression to multiclass problems, i.e. with more than two possible discrete outcomes. That is, it is a model that is used to predict the probabilities of the different possible outcomes of a categorically distributed dependent variable, given a set of independent variables.

In statistics, the Kendall rank correlation coefficient, commonly referred to as Kendall's τ coefficient, is a statistic used to measure the ordinal association between two measured quantities. A τ test is a non-parametric hypothesis test for statistical dependence based on the τ coefficient. It is a measure of rank correlation: the similarity of the orderings of the data when ranked by each of the quantities. It is named after Maurice Kendall, who developed it in 1938, though Gustav Fechner had proposed a similar measure in the context of time series in 1897.

Equilibrium constants are determined in order to quantify chemical equilibria. When an equilibrium constant K is expressed as a concentration quotient,

Youden's J statistic is a single statistic that captures the performance of a dichotomous diagnostic test. (Bookmaker) Informedness is its generalization to the multiclass case and estimates the probability of an informed decision.

<span class="mw-page-title-main">Precision and recall</span> Pattern-recognition performance metrics

In pattern recognition, information retrieval, object detection and classification, precision and recall are performance metrics that apply to data retrieved from a collection, corpus or sample space.

In statistics, the phi coefficient is a measure of association for two binary variables.

The Fowlkes–Mallows index is an external evaluation method that is used to determine the similarity between two clusterings, and also a metric to measure confusion matrices. This measure of similarity could be either between two hierarchical clusterings or a clustering and a benchmark classification. A higher value for the Fowlkes–Mallows index indicates a greater similarity between the clusters and the benchmark classifications. It was invented by Bell Labs statisticians Edward Fowlkes and Collin Mallows in 1983.

<span class="mw-page-title-main">Evaluation of binary classifiers</span>

The evaluation of binary classifiers compares two methods of assigning a binary attribute, one of which is usually a standard method and the other is being investigated. There are many metrics that can be used to measure the performance of a classifier or predictor; different fields have different preferences for specific metrics due to different goals. For example, in medicine sensitivity and specificity are often used, while in computer science precision and recall are preferred. An important distinction is between metrics that are independent on the prevalence, and metrics that depend on the prevalence – both types are useful, but they have very different properties.

Evaluation measures for an information retrieval (IR) system assess how well an index, search engine, or database returns results from a collection of resources that satisfy a user's query. They are therefore fundamental to the success of information systems and digital platforms.

P4 metric enables performance evaluation of the binary classifier. It is calculated from precision, recall, specificity and NPV (negative predictive value). P4 is designed in similar way to F1 metric, however addressing the criticisms leveled against F1. It may be perceived as its extension.

References

  1. Sasaki, Y. (PDF) https://nicolasshu.com/assets/pdf/Sasaki_2007_The%20Truth%20of%20the%20F-measure.pdf.{{cite news}}: Missing or empty |title= (help)
  2. Aziz Taha, Abdel (2015). "Metrics for evaluating 3D medical image segmentation: analysis, selection, and tool". BMC Medical Imaging. 15 (29): 1–28. doi: 10.1186/s12880-015-0068-x . PMC   4533825 . PMID   26263899.
  3. Van Rijsbergen, C. J. (1979). Information Retrieval (2nd ed.). Butterworth-Heinemann.
  4. Balayla, Jacques (2020). "Prevalence threshold (ϕe) and the geometry of screening curves". PLOS ONE. 15 (10): e0240215. doi: 10.1371/journal.pone.0240215 . PMID   33027310.
  5. Fawcett, Tom (2006). "An Introduction to ROC Analysis" (PDF). Pattern Recognition Letters. 27 (8): 861–874. doi:10.1016/j.patrec.2005.10.010. S2CID   2027090.
  6. Piryonesi S. Madeh; El-Diraby Tamer E. (2020-03-01). "Data Analytics in Asset Management: Cost-Effective Prediction of the Pavement Condition Index". Journal of Infrastructure Systems. 26 (1): 04019036. doi:10.1061/(ASCE)IS.1943-555X.0000512. S2CID   213782055.
  7. Powers, David M. W. (2011). "Evaluation: From Precision, Recall and F-Measure to ROC, Informedness, Markedness & Correlation". Journal of Machine Learning Technologies. 2 (1): 37–63.
  8. Ting, Kai Ming (2011). Sammut, Claude; Webb, Geoffrey I. (eds.). Encyclopedia of machine learning. Springer. doi:10.1007/978-0-387-30164-8. ISBN   978-0-387-30164-8.
  9. Brooks, Harold; Brown, Barb; Ebert, Beth; Ferro, Chris; Jolliffe, Ian; Koh, Tieh-Yong; Roebber, Paul; Stephenson, David (2015-01-26). "WWRP/WGNE Joint Working Group on Forecast Verification Research". Collaboration for Australian Weather and Climate Research. World Meteorological Organisation. Retrieved 2019-07-17.
  10. Chicco D, Jurman G (January 2020). "The advantages of the Matthews correlation coefficient (MCC) over F1 score and accuracy in binary classification evaluation". BMC Genomics. 21 (1): 6-1–6-13. doi: 10.1186/s12864-019-6413-7 . PMC   6941312 . PMID   31898477.
  11. Chicco D, Toetsch N, Jurman G (February 2021). "The Matthews correlation coefficient (MCC) is more reliable than balanced accuracy, bookmaker informedness, and markedness in two-class confusion matrix evaluation". BioData Mining. 14 (13): 13. doi: 10.1186/s13040-021-00244-z . PMC   7863449 . PMID   33541410.
  12. Tharwat A. (August 2018). "Classification assessment methods". Applied Computing and Informatics. 17: 168–192. doi: 10.1016/j.aci.2018.08.003 .
  13. Brabec, Jan; Komárek, Tomáš; Franc, Vojtěch; Machlica, Lukáš (2020). "On model evaluation under non-constant class imbalance". International Conference on Computational Science. Springer. pp. 74–87. arXiv: 2001.05571 . doi: 10.1007/978-3-030-50423-6_6 .
  14. Siblini, W.; Fréry, J.; He-Guelton, L.; Oblé, F.; Wang, Y. Q. (2020). "Master your metrics with calibration". In M. Berthold; A. Feelders; G. Krempl (eds.). Advances in Intelligent Data Analysis XVIII. Springer. pp. 457–469. arXiv: 1909.02827 . doi: 10.1007/978-3-030-44584-3_36 .
  15. Beitzel., Steven M. (2006). On Understanding and Classifying Web Queries (Ph.D. thesis). IIT. CiteSeerX   10.1.1.127.634 .
  16. X. Li; Y.-Y. Wang; A. Acero (July 2008). Learning query intent from regularized click graphs. Proceedings of the 31st SIGIR Conference. p. 339. doi:10.1145/1390334.1390393. ISBN   9781605581644. S2CID   8482989.
  17. See, e.g., the evaluation of the .
  18. Powers, David M. W (2015). "What the F-measure doesn't measure". arXiv: 1503.06410 [cs.IR].
  19. Derczynski, L. (2016). Complementarity, F-score, and NLP Evaluation. Proceedings of the International Conference on Language Resources and Evaluation.
  20. Manning, Christopher (April 1, 2009). An Introduction to Information Retrieval (PDF). Exercise 8.7: Cambridge University Press. p. 200. Retrieved 18 July 2022.{{cite book}}: CS1 maint: location (link)
  21. "What is the baseline of the F1 score for a binary classifier?".
  22. Lipton, Z.C., Elkan, C.P., & Narayanaswamy, B. (2014). F1-Optimal Thresholding in the Multi-Label Setting. ArXiv, abs/1402.1892.
  23. Hand, David. "A note on using the F-measure for evaluating record linkage algorithms - Dimensions". app.dimensions.ai. doi:10.1007/s11222-017-9746-6. hdl: 10044/1/46235 . S2CID   38782128 . Retrieved 2018-12-08.
  24. Chicco D, Jurman G (January 2020). "The advantages of the Matthews correlation coefficient (MCC) over F1 score and accuracy in binary classification evaluation". BMC Genomics. 21 (6): 6. doi: 10.1186/s12864-019-6413-7 . PMC   6941312 . PMID   31898477.
  25. Powers, David M W (2011). "Evaluation: From Precision, Recall and F-Score to ROC, Informedness, Markedness & Correlation". Journal of Machine Learning Technologies. 2 (1): 37–63. hdl:2328/27165.
  26. Sitarz, Mikolaj (2022). "Extending F1 metric, probabilistic approach". arXiv: 2210.11997 [cs.LG].
  27. Tharwat A (August 2018). "Classification assessment methods". Applied Computing and Informatics. 17: 168–192. doi: 10.1016/j.aci.2018.08.003 .
  28. J. Opitz; S. Burst (2019). "Macro F1 and Macro F1". arXiv: 1911.03347 [stat.ML].