The simple matching coefficient (SMC) or Rand similarity coefficient is a statistic used for comparing the similarity and diversity of sample sets. [1]
| A |
|---|
| 0 | 1 |
|---|
| B | 0 |  |  |
|---|
| 1 |  |  |
|---|
Given two objects, A and B, each with n binary attributes, SMC is defined as:

where:
- is the total number of attributes where A and B both have a value of 0.
- is the total number of attributes where A and B both have a value of 1.
- is the total number of attributes where the attribute of A is 0 and the attribute of B is 1.
- is the total number of attributes where the attribute of A is 1 and the attribute of B is 0.
The simple matching distance (SMD), which measures dissimilarity between sample sets, is given by  . [2]
. [2]
SMC is linearly related to Hamann similarity:  . Also,
  , where
  is the squared Euclidean distance between the two objects (binary vectors) and n is the number of attributes.
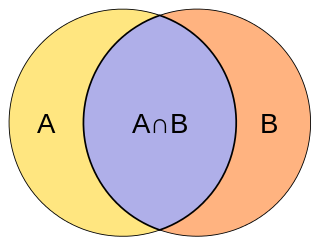
The SMC is very similar to the more popular Jaccard index. The main difference is that the SMC has the term in its numerator and denominator, whereas the Jaccard index does not. Thus, the SMC counts both mutual presences (when an attribute is present in both sets) and mutual absence (when an attribute is absent in both sets) as matches and compares it to the total number of attributes in the universe, whereas the Jaccard index only counts mutual presence as matches and compares it to the number of attributes that have been chosen by at least one of the two sets.
In market basket analysis, for example, the basket of two consumers who we wish to compare might only contain a small fraction of all the available products in the store, so the SMC will usually return very high values of similarities even when the baskets bear very little resemblance, thus making the Jaccard index a more appropriate measure of similarity in that context. For example, consider a supermarket with 1000 products and two customers. The basket of the first customer contains salt and pepper and the basket of the second contains salt and sugar. In this scenario, the similarity between the two baskets as measured by the Jaccard index would be 1/3, but the similarity becomes 0.998 using the SMC.
In other contexts, where 0 and 1 carry equivalent information (symmetry), the SMC is a better measure of similarity. For example, vectors of demographic variables stored in dummy variables, such as binary gender, would be better compared with the SMC than with the Jaccard index since the impact of gender on similarity should be equal, independently of whether male is defined as a 0 and female as a 1 or the other way around. However, when we have symmetric dummy variables, one could replicate the behaviour of the SMC by splitting the dummies into two binary attributes (in this case, male and female), thus transforming them into asymmetric attributes, allowing the use of the Jaccard index without introducing any bias. By using this trick, the Jaccard index can be considered as making the SMC a fully redundant metric. The SMC remains, however, more computationally efficient in the case of symmetric dummy variables since it does not require adding extra dimensions.
The Jaccard index is also more general than the SMC and can be used to compare other data types than just vectors of binary attributes, such as probability measures.
Vector quantization (VQ) is a classical quantization technique from signal processing that allows the modeling of probability density functions by the distribution of prototype vectors. It was originally used for data compression. It works by dividing a large set of points (vectors) into groups having approximately the same number of points closest to them. Each group is represented by its centroid point, as in k-means and some other clustering algorithms.

In statistics, the logistic model is a statistical model that models the probability of an event taking place by having the log-odds for the event be a linear combination of one or more independent variables. In regression analysis, logistic regression is estimating the parameters of a logistic model. Formally, in binary logistic regression there is a single binary dependent variable, coded by an indicator variable, where the two values are labeled "0" and "1", while the independent variables can each be a binary variable or a continuous variable. The corresponding probability of the value labeled "1" can vary between 0 and 1, hence the labeling; the function that converts log-odds to probability is the logistic function, hence the name. The unit of measurement for the log-odds scale is called a logit, from logistic unit, hence the alternative names. See § Background and § Definition for formal mathematics, and § Example for a worked example.
In mathematics, a quadratic form is a polynomial with terms all of degree two. For example,
An integer programming problem is a mathematical optimization or feasibility program in which some or all of the variables are restricted to be integers. In many settings the term refers to integer linear programming (ILP), in which the objective function and the constraints are linear.

Cluster analysis or clustering is the task of grouping a set of objects in such a way that objects in the same group are more similar to each other than to those in other groups (clusters). It is a main task of exploratory data analysis, and a common technique for statistical data analysis, used in many fields, including pattern recognition, image analysis, information retrieval, bioinformatics, data compression, computer graphics and machine learning.

In mathematics, a Boolean function is a function whose arguments and result assume values from a two-element set. Alternative names are switching function, used especially in older computer science literature, and truth function, used in logic. Boolean functions are the subject of Boolean algebra and switching theory.
In statistics, a contingency table is a type of table in a matrix format that displays the (multivariate) frequency distribution of the variables. They are heavily used in survey research, business intelligence, engineering, and scientific research. They provide a basic picture of the interrelation between two variables and can help find interactions between them. The term contingency table was first used by Karl Pearson in "On the Theory of Contingency and Its Relation to Association and Normal Correlation", part of the Drapers' Company Research Memoirs Biometric Series I published in 1904.

In statistics, the coefficient of determination, denoted R2 or r2 and pronounced "R squared", is the proportion of the variation in the dependent variable that is predictable from the independent variable(s).
The Jaccard index, also known as the Jaccard similarity coefficient, is a statistic used for gauging the similarity and diversity of sample sets. It was developed by Grove Karl Gilbert in 1884 as his ratio of verification (v) and now is frequently referred to as the Critical Success Index in meteorology. It was later developed independently by Paul Jaccard, originally giving the French name coefficient de communauté, and independently formulated again by T. Tanimoto. Thus, the Tanimoto index or Tanimoto coefficient are also used in some fields. However, they are identical in generally taking the ratio of Intersection over Union. The Jaccard coefficient measures similarity between finite sample sets, and is defined as the size of the intersection divided by the size of the union of the sample sets:
In statistics, multinomial logistic regression is a classification method that generalizes logistic regression to multiclass problems, i.e. with more than two possible discrete outcomes. That is, it is a model that is used to predict the probabilities of the different possible outcomes of a categorically distributed dependent variable, given a set of independent variables.

The Rand index or Rand measure in statistics, and in particular in data clustering, is a measure of the similarity between two data clusterings. A form of the Rand index may be defined that is adjusted for the chance grouping of elements, this is the adjusted Rand index. From a mathematical standpoint, Rand index is related to the accuracy, but is applicable even when class labels are not used.
In statistics, the Kendall rank correlation coefficient, commonly referred to as Kendall's τ coefficient, is a statistic used to measure the ordinal association between two measured quantities. A τ test is a non-parametric hypothesis test for statistical dependence based on the τ coefficient.
In data analysis, cosine similarity is a measure of similarity between two non-zero vectors defined in an inner product space. Cosine similarity is the cosine of the angle between the vectors; that is, it is the dot product of the vectors divided by the product of their lengths. It follows that the cosine similarity does not depend on the magnitudes of the vectors, but only on their angle. The cosine similarity always belongs to the interval For example, two proportional vectors have a cosine similarity of 1, two orthogonal vectors have a similarity of 0, and two opposite vectors have a similarity of -1. In some contexts, the component values of the vectors cannot be negative, in which case the cosine similarity is bounded in .
An index of qualitative variation (IQV) is a measure of statistical dispersion in nominal distributions. There are a variety of these, but they have been relatively little-studied in the statistics literature. The simplest is the variation ratio, while more complex indices include the information entropy.
The Sørensen–Dice coefficient is a statistic used to gauge the similarity of two samples. It was independently developed by the botanists Thorvald Sørensen and Lee Raymond Dice, who published in 1948 and 1945 respectively.
In mathematics and computer science, a string metric is a metric that measures distance between two text strings for approximate string matching or comparison and in fuzzy string searching. A requirement for a string metric is fulfillment of the triangle inequality. For example, the strings "Sam" and "Samuel" can be considered to be close. A string metric provides a number indicating an algorithm-specific indication of distance.
In statistics, the phi coefficient is a measure of association for two binary variables. In machine learning, it is known as the Matthews correlation coefficient (MCC) and used as a measure of the quality of binary (two-class) classifications, introduced by biochemist Brian W. Matthews in 1975. Introduced by Karl Pearson, and also known as the Yule phi coefficient from its introduction by Udny Yule in 1912 this measure is similar to the Pearson correlation coefficient in its interpretation. In fact, a Pearson correlation coefficient estimated for two binary variables will return the phi coefficient. Two binary variables are considered positively associated if most of the data falls along the diagonal cells. In contrast, two binary variables are considered negatively associated if most of the data falls off the diagonal. If we have a 2×2 table for two random variables x and y
The Tversky index, named after Amos Tversky, is an asymmetric similarity measure on sets that compares a variant to a prototype. The Tversky index can be seen as a generalization of the Sørensen–Dice coefficient and the Jaccard index.
In computer science and data mining, MinHash is a technique for quickly estimating how similar two sets are. The scheme was invented by Andrei Broder (1997), and initially used in the AltaVista search engine to detect duplicate web pages and eliminate them from search results. It has also been applied in large-scale clustering problems, such as clustering documents by the similarity of their sets of words.
The Fowlkes–Mallows index is an external evaluation method that is used to determine the similarity between two clusterings, and also a metric to measure confusion matrices. This measure of similarity could be either between two hierarchical clusterings or a clustering and a benchmark classification. A higher value for the Fowlkes–Mallows index indicates a greater similarity between the clusters and the benchmark classifications. It was invented by Bell Labs statisticians Edward Fowlkes and Collin Mallows in 1983.