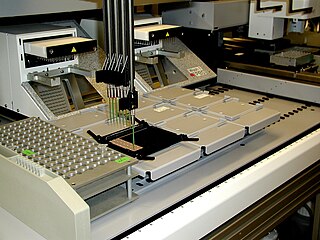
Proteomics is the large-scale study of proteins. Proteins are vital macromolecules of all living organisms, with many functions such as the formation of structural fibers of muscle tissue, enzymatic digestion of food, or synthesis and replication of DNA. In addition, other kinds of proteins include antibodies that protect an organism from infection, and hormones that send important signals throughout the body.
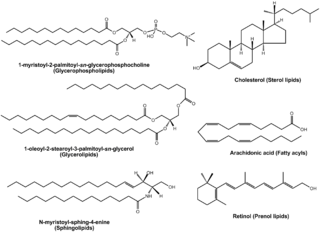
Lipidomics is the large-scale study of pathways and networks of cellular lipids in biological systems. The word "lipidome" is used to describe the complete lipid profile within a cell, tissue, organism, or ecosystem and is a subset of the "metabolome" which also includes other major classes of biological molecules. Lipidomics is a relatively recent research field that has been driven by rapid advances in technologies such as mass spectrometry (MS), nuclear magnetic resonance (NMR) spectroscopy, fluorescence spectroscopy, dual polarisation interferometry and computational methods, coupled with the recognition of the role of lipids in many metabolic diseases such as obesity, atherosclerosis, stroke, hypertension and diabetes. This rapidly expanding field complements the huge progress made in genomics and proteomics, all of which constitute the family of systems biology.

Metabolomics is the scientific study of chemical processes involving metabolites, the small molecule substrates, intermediates, and products of cell metabolism. Specifically, metabolomics is the "systematic study of the unique chemical fingerprints that specific cellular processes leave behind", the study of their small-molecule metabolite profiles. The metabolome represents the complete set of metabolites in a biological cell, tissue, organ, or organism, which are the end products of cellular processes. Messenger RNA (mRNA), gene expression data, and proteomic analyses reveal the set of gene products being produced in the cell, data that represents one aspect of cellular function. Conversely, metabolic profiling can give an instantaneous snapshot of the physiology of that cell, and thus, metabolomics provides a direct "functional readout of the physiological state" of an organism. There are indeed quantifiable correlations between the metabolome and the other cellular ensembles, which can be used to predict metabolite abundances in biological samples from, for example mRNA abundances. One of the ultimate challenges of systems biology is to integrate metabolomics with all other -omics information to provide a better understanding of cellular biology.
Mass spectrometry is a scientific technique for measuring the mass-to-charge ratio of ions. It is often coupled to chromatographic techniques such as gas- or liquid chromatography and has found widespread adoption in the fields of analytical chemistry and biochemistry where it can be used to identify and characterize small molecules and proteins (proteomics). The large volume of data produced in a typical mass spectrometry experiment requires that computers be used for data storage and processing. Over the years, different manufacturers of mass spectrometers have developed various proprietary data formats for handling such data which makes it difficult for academic scientists to directly manipulate their data. To address this limitation, several open, XML-based data formats have recently been developed by the Trans-Proteomic Pipeline at the Institute for Systems Biology to facilitate data manipulation and innovation in the public sector. These data formats are described here.
Insilicos is a life science software company founded in 2002 by Erik Nilsson, Brian Pratt and Bryan Prazen. Insilicos develops scientific computing software to provide software for disease diagnoses.

Ion mobility spectrometry (IMS) It is a method of conducting analytical research that separates and identifies ionized molecules present in the gas phase based on the mobility of the molecules in a carrier buffer gas. Even though it is used extensively for military or security objectives, such as detecting drugs and explosives, the technology also has many applications in laboratory analysis, including studying small and big biomolecules. IMS instruments are extremely sensitive stand-alone devices, but are often coupled with mass spectrometry, gas chromatography or high-performance liquid chromatography in order to achieve a multi-dimensional separation. They come in various sizes, ranging from a few millimetres to several metres depending on the specific application, and are capable of operating under a broad range of conditions. IMS instruments such as microscale high-field asymmetric-waveform ion mobility spectrometry can be palm-portable for use in a range of applications including volatile organic compound (VOC) monitoring, biological sample analysis, medical diagnosis and food quality monitoring. Systems operated at higher pressure are often accompanied by elevated temperature, while lower pressure systems (1–20 hPa) do not require heating.

MALDI mass spectrometry imaging (MALDI-MSI) is the use of matrix-assisted laser desorption ionization as a mass spectrometry imaging technique in which the sample, often a thin tissue section, is moved in two dimensions while the mass spectrum is recorded. Advantages, like measuring the distribution of a large amount of analytes at one time without destroying the sample, make it a useful method in tissue-based study.
Mass spectrometry imaging (MSI) is a technique used in mass spectrometry to visualize the spatial distribution of molecules, as biomarkers, metabolites, peptides or proteins by their molecular masses. After collecting a mass spectrum at one spot, the sample is moved to reach another region, and so on, until the entire sample is scanned. By choosing a peak in the resulting spectra that corresponds to the compound of interest, the MS data is used to map its distribution across the sample. This results in pictures of the spatially resolved distribution of a compound pixel by pixel. Each data set contains a veritable gallery of pictures because any peak in each spectrum can be spatially mapped. Despite the fact that MSI has been generally considered a qualitative method, the signal generated by this technique is proportional to the relative abundance of the analyte. Therefore, quantification is possible, when its challenges are overcome. Although widely used traditional methodologies like radiochemistry and immunohistochemistry achieve the same goal as MSI, they are limited in their abilities to analyze multiple samples at once, and can prove to be lacking if researchers do not have prior knowledge of the samples being studied. Most common ionization technologies in the field of MSI are DESI imaging, MALDI imaging, secondary ion mass spectrometry imaging and Nanoscale SIMS (NanoSIMS).
The Proteomics Standards Initiative (PSI) is a working group of the Human Proteome Organization. It aims to define data standards for proteomics to facilitate data comparison, exchange and verification.

Capillary electrophoresis–mass spectrometry (CE–MS) is an analytical chemistry technique formed by the combination of the liquid separation process of capillary electrophoresis with mass spectrometry. CE–MS combines advantages of both CE and MS to provide high separation efficiency and molecular mass information in a single analysis. It has high resolving power and sensitivity, requires minimal volume and can analyze at high speed. Ions are typically formed by electrospray ionization, but they can also be formed by matrix-assisted laser desorption/ionization or other ionization techniques. It has applications in basic research in proteomics and quantitative analysis of biomolecules as well as in clinical medicine. Since its introduction in 1987, new developments and applications have made CE-MS a powerful separation and identification technique. Use of CE–MS has increased for protein and peptides analysis and other biomolecules. However, the development of online CE–MS is not without challenges. Understanding of CE, the interface setup, ionization technique and mass detection system is important to tackle problems while coupling capillary electrophoresis to mass spectrometry.
The OpenMS Proteomics Pipeline (TOPP) is a set of computational tools that can be chained together to tailor problem-specific analysis pipelines for HPLC-MS data. It transforms most of the OpenMS functionality into small command line tools that are the building blocks for more complex analysis pipelines. The functionality of the tools ranges from data preprocessing over quantitation to identification.
The Netherlands Bioinformatics for Proteomics Platform (NBPP) is joint initiative of the Netherlands Bioinformatics Centre (NBIC) and the Netherlands Proteomics Centre (NPC).

OpenChrom is an open source software for the analysis and visualization of mass spectrometric and chromatographic data. Its focus is to handle native data files from several mass spectrometry systems, vendors like Agilent Technologies, Varian, Shimadzu, Thermo Fisher, PerkinElmer and others. But also data formats from other detector types are supported recently.
The PRIDE is a public data repository of mass spectrometry-based proteomics data, and is maintained by the European Bioinformatics Institute as part of the Proteomics Team.
ProteoWizard is a set of open-source, cross-platform tools and libraries for proteomics data analyses. It provides a framework for unified mass spectrometry data file access and performs standard chemistry and LCMS dataset computations. Specifically, it is able to read many of the vendor-specific, proprietary formats and converting the data into an open data format.
David Fenyö is a Hungarian-Swedish-American computational biologist, physicist and businessman. He is currently professor in the Department of Biochemistry and Molecular Pharmacology at NYU Langone Medical Center. Fenyö's research focuses on the development of methods to identify, characterize and quantify proteins and in the integration of data from multiple modalities including mass spectrometry, sequencing and microscopy.
Skyline is an open source software for targeted proteomics and metabolomics data analysis. It runs on Microsoft Windows and supports the raw data formats from multiple mass spectrometric vendors. It contains a graphical user interface to display chromatographic data for individual peptide or small molecule analytes.
The 'German Network for Bioinformatics Infrastructure – de.NBI' is a national, academic and non-profit infrastructure initiated by the Federal Ministry of Education and Research funding 2015-2021. The network provides bioinformatics services to users in life sciences research and biomedicine in Germany and Europe. The partners organize training events, courses and summer schools on tools, standards and compute services provided by de.NBI to assist researchers to more effectively exploit their data. From 2022, the network will be integrated into Forschungszentrum Jülich.
SIRIUS is a Java-based open-source software for the identification of small molecules from fragmentation mass spectrometry data without the use of spectral libraries. It combines the analysis of isotope patterns in MS1 spectra with the analysis of fragmentation patterns in MS2 spectra. SIRIUS is the umbrella application comprising CSI:FingerID, CANOPUS, COSMIC and ZODIAC.