There is a wide array of commands available for making graphics. Coordinates in PSTricks are always represented in parentheses, as the following example (scaled) illustrates:
\begin{pspicture}(5,5) %% Triangle in red:\pspolygon[linecolor=red](1,1)(5,1)(1,4) %% Bezier curve in green:\pscurve[linecolor=green,linewidth=2pt,% showpoints=true](5,5)(3,2)(4,4)(2,3) %% Circle in blue with radius 1:\pscircle[linecolor=blue,linestyle=dashed](3,2.5){1}\end{pspicture}
PSTricks commands are low level, so many LaTeX packages have been made in order to ease the creation of several kinds of graphics that are commonly used on mathematical typesetting.
pst-plot provides commands for creating function graphs.
Consider the following example:
\begin{pspicture*}(-7,-2)(7,2) \psaxes[labels=none](0,0)(-7,-2)(7,2) % sets up axis\psplot[linecolor=blue, linewidth=1.5pt]% % plots the sinewave{-7}{7}{x 0.01745329252 div sin}% notice the RPN expression\uput[45](3.1415926,0){$\pi$}% these are the labels\uput[90](-1.570796,0){$-\pi/2$}% \uput is a box positioned at [angle]\uput[-90](1.570796,0){$\pi/2$}% relative to (x,y) coordinate\uput[-135](-3.1415926,0){$-\pi$}% and putting { content } on the box\psline[linewidth=1pt,linecolor=red,linestyle=dotted]% % red dotted lines (1.57079632,1)(1.57079632,0) \psline[linewidth=1pt,linecolor=red,linestyle=dotted]% (-1.57079632,-1)(-1.57079632,0) \end{pspicture*}
The previous example also illustrate that TeX commands can be used as elements into the pictures. Since PostScript uses RPN style for mathematical operations, the argument to pst-plot must be supplied in the same form. An alternative is to use the optional argument algebraic, then the formula can be described as an algebraic expression.
pstricks-add extends pst-plot enabling also polar graphs and allowing the use algebraic notation for plots instead of RPN.
PSTricks is only fully compatible with TeX systems using PostScript intermediates, including but not limited to eTeX and others. However, it is not compatible with the widely used pdfTeX engine in PDF mode. As pdfTeX is the default engine in most current installations, users of PSTricks must either force pdfTeX to DVI mode or use auto-pst-pdf. PGF/TikZ is an alternative to PSTricks that is compatible with pdfTeX.
Herbert Voss; PSTricks– Grafik für TeX und LaTeX, 7th edition, DANTE e.V. and Lehmanns.media, 1008 pages, Heidelberg and Berlin 2016, ISBN978-3-86541-858-6.
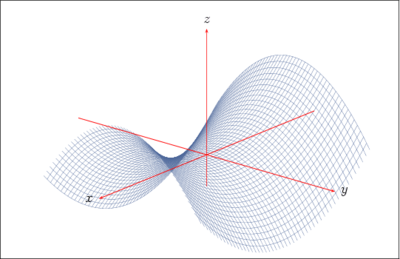
gnuplot is a command-line and GUI program that can generate two- and three-dimensional plots of functions, data, and data fits. The program runs on all major computers and operating systems . Originally released in 1986, its listed authors are Thomas Williams, Colin Kelley, Russell Lang, Dave Kotz, John Campbell, Gershon Elber, Alexander Woo "and many others." Despite its name, this software is not part of the GNU Project.
Maple is a symbolic and numeric computing environment as well as a multi-paradigm programming language. It covers several areas of technical computing, such as symbolic mathematics, numerical analysis, data processing, visualization, and others. A toolbox, MapleSim, adds functionality for multidomain physical modeling and code generation.
GNU TeXmacs is a scientific word processor and typesetting component of the GNU Project. It originated as a variant of GNU Emacs with TeX functionalities, though it shares no code with those programs, while using TeX fonts. It is written and maintained by Joris van der Hoeven and a group of developers. The program produces structured documents with a WYSIWYG user interface. New document styles can be created by the user. The editor provides high-quality typesetting algorithms and TeX and other fonts for publishing professional looking documents.
The device independent file format (DVI) is the output file format of the TeX typesetting program, designed by David R. Fuchs and implemented by Donald E. Knuth in 1982. Unlike the TeX markup files used to generate them, DVI files are not intended to be human-readable; they consist of binary data describing the visual layout of a document in a manner not reliant on any specific image format, display hardware or printer. DVI files are typically used as input to a second program which translates DVI files to graphical data. For example, most TeX software packages include a program for previewing DVI files on a user's computer display; this program is a driver. Drivers are also used to convert from DVI to popular page description languages and for printing.
MetaPost refers to both a programming language and the interpreter of the MetaPost programming language. Both are derived from Donald Knuth's Metafont language and interpreter. MetaPost produces vector graphic diagrams from a geometric/algebraic description. The language shares Metafont's declarative syntax for manipulating lines, curves, points and geometric transformations. However,
Inkscape is a free and open-source vector graphics editor for traditional Unix-compatible systems such as GNU/Linux, BSD derivatives and Illumos, as well as Windows and macOS. It offers a rich set of features and is widely used for both artistic and technical illustrations such as cartoons, clip art, logos, typography, diagramming and flowcharting. It uses vector graphics to allow for sharp printouts and renderings at unlimited resolution and is not bound to a fixed number of pixels like raster graphics. Inkscape uses the standardized Scalable Vector Graphics (SVG) file format as its main format, which is supported by many other applications including web browsers. It can import and export various other file formats, including SVG, AI, EPS, PDF, PS and PNG.
Xfig is a free and open-source vector graphics editor which runs under the X Window System on most UNIX-compatible platforms.
DOT is a graph description language, developed as a part of the Graphviz project. DOT graphs are typically stored as files with the .gv or .dot filename extension — .gv is preferred, to avoid confusion with the .dot extension used by versions of Microsoft Word before 2007. dot is also the name of the main program to process DOT files in the Graphviz package.
A diagram is a symbolic representation of information using visualization techniques. Diagrams have been used since prehistoric times on walls of caves, but became more prevalent during the Enlightenment. Sometimes, the technique uses a three-dimensional visualization which is then projected onto a two-dimensional surface. The word graph is sometimes used as a synonym for diagram.
ConTeXt is a general-purpose document processor. Like LaTeX, it is derived from TeX. It is especially suited for structured documents, automated document production, very fine typography, and multilingual typesetting. It is based in part on the TeX typesetting system, and uses a document markup language for manuscript preparation. The typographical and automated capabilities of ConTeXt are extensive, including interfaces for handling microtypography, multiple footnotes and footnote classes, and manipulating OpenType fonts and features. Moreover, it offers extensive support for colors, backgrounds, hyperlinks, presentations, figure-text integration, and conditional compilation. It gives the user extensive control over formatting while making it easy to create new layouts and styles without learning the low-level TeX macro language.
Cairo is an open-source graphics library that provides a vector graphics-based, device-independent API for software developers. It provides primitives for two-dimensional drawing across a number of different backends. Cairo uses hardware acceleration when available.
A number of vector graphics editors exist for various platforms. Potential users of these editors will make a comparison of vector graphics editors based on factors such as the availability for the user's platform, the software license, the feature set, the merits of the user interface (UI) and the focus of the program. Some programs are more suitable for artistic work while others are better for technical drawings. Another important factor is the application's support of various vector and bitmap image formats for import and export.
Asymptote is a descriptive vector graphics language – developed by Andy Hammerlindl, John C. Bowman, and Tom Prince – which provides a natural coordinate-based framework for technical drawing. Asymptote runs on all major platforms. It is free software, available under the terms of the GNU Lesser General Public License (LGPL).
The computer program pdfTeX is an extension of Knuth's typesetting program TeX, and was originally written and developed into a publicly usable product by Hàn Thế Thành as a part of the work for his PhD thesis at the Faculty of Informatics, Masaryk University, Brno, Czech Republic. The idea of making this extension to TeX was conceived during the early 1990s, when Jiří Zlatuška and Phil Taylor discussed some developmental ideas with Donald Knuth at Stanford University. Knuth later met Hàn Thế Thành in Brno during his visit to the Faculty of Informatics to receive an honorary doctorate from Masaryk University.
PGF/TikZ is a pair of languages for producing vector graphics from a geometric/algebraic description, with standard features including the drawing of points, lines, arrows, paths, circles, ellipses and polygons. PGF is a lower-level language, while TikZ is a set of higher-level macros that use PGF. The top-level PGF and TikZ commands are invoked as TeX macros, but in contrast with PSTricks, the PGF/TikZ graphics themselves are described in a language that resembles MetaPost. Till Tantau is the designer of the PGF and TikZ languages. He is also the main developer of the only known interpreter for PGF and TikZ, which is written in TeX. PGF is an acronym for "Portable Graphics Format". TikZ was introduced in version 0.95 of PGF, and it is a recursive acronym for "TikZ ist kein Zeichenprogramm".
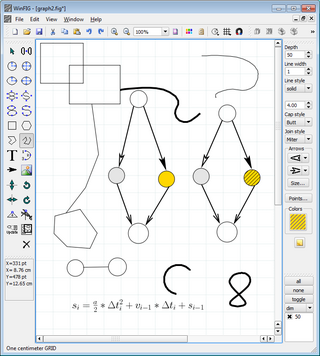
WinFIG is a proprietary shareware vector graphics editor application. The file format and rendering are as close to Xfig as possible, but the program takes advantage of Windows features like clipboard, printer preview, multiple documents etc.
PyX is a Python package for the creation of PostScript, PDF, and static SVG files. It combines an abstraction of the PostScript drawing model with a TeX/LaTeX interface. Complex tasks like 2d and 3d plots in publication-ready quality are built out of these primitives. Its goals are similar to those of other metalanguages for PDF drawing, such as TikZ or Asymptote.
This page is based on this Wikipedia article Text is available under the CC BY-SA 4.0 license; additional terms may apply. Images, videos and audio are available under their respective licenses.