Kig (software)

Last updated
Kig
Developer(s) KDE
Initial release2 August 2006 (2006-08-02)
Stable release
22.12.0 [1]   OOjs UI icon edit-ltr-progressive.svg / 8 December 2022;59 days ago (8 December 2022)
Repository
Written in C++ (Qt)
Operating system Unix-like, Mac OS X, Windows
Type Interactive geometry software
License GPL
Website https://apps.kde.org/kig/

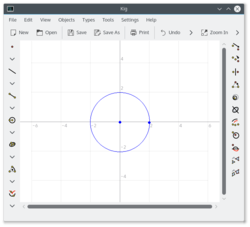
KIG is free and open-source interactive geometry software, which is part of the KDE Education Project. It has some facilities for scripting in Python, as well as the creating macros from existing constructions.

Contents

Import and export

Kig can import files made by DrGeo and Cabri Geometry as well as its own file format, which is XML-encoded. Kig can export figures in LaTeX format and as SVG (vector graphics) files.

Objects

Kig can handle any classical object of the dynamic geometry, but also:

  1. The center of curvature and osculating circle of a curve;
  2. The dilation, generic affinity, inversion, projective application, homography and harmonic homology;
  3. The hyperbola with given asymptotes;
  4. The Bézier curves (2nd and 3rd degree);
  5. The polar line of a point and pole of a line with respect to a conic section;
  6. The asymptotes of a hyperbola;
  7. The cubic curve through 9 points;
  8. The cubic curve with a double point through 6 points;
  9. The cubic curve with a cusp through 4 points.

Scripting language

Inside the figure

Another object is available inside Kig, it is a Python language script. It can accept Kig objects as variables, and always return one object.

For example, if there is already a numeric object inside the figure, for example 3, the following Python object can yield its square (9):

defsquare(arg1):returnDoubleObject(arg1.value()**2)

The variables are always called arg1, arg2 etc. in the order they are clicked upon. Here there is only one variable arg1 and its numerical value is obtained with arg1.value().

If no one wants to implement the square of a complex number (represented by a point in the Argand diagram), the object which has to be selected at the creation of the script must necessarily be a point, and the script is

defcsquare(arg1):x=arg1.coordinate().xy=arg1.coordinate().yz=x*x-y*yy=2*x*yx=zreturnPoint(Coordinate(x,y))

The abscissa of the point representing the square of the complex number is as can be seen by expanding , Coordinate(x,y) creates a Python list made of the two coordinates of the new point. And Point creates the point which coordinates are precisely given by this list.

But a Python object inside a figure can only create one object and for more complex figures one has to build the figure with a script:

Figure created by a script

Kig comes up with a little program (written in Python) called pykig.py which can

  1. load a Python script, e.g. MyScript.py
  2. build a Kig figure, described by this script
  3. open Kig and display the figure.

For example, here is how a Sierpinski triangle can be made (as an IFS) with pykig:

fromrandomimport*kigdocument.hideobjects()A=Point(0,2)A.show()B=Point(-2,-1)B.show()C=Point(2,-1)C.show()M=Point(.1,.1)foriinrange(1,1000):d=randrange(3)ifd==0:s=Segment(A,M)M=s.midpoint()ifd==1:s=Segment(B,M)M=s.midpoint()ifd==2:s=Segment(C,M)M=s.midpoint()M.show()
  1. "Releases 22.12.0 2022-12-08" . Retrieved 20 December 2022.

Related Research Articles

<span class="mw-page-title-main">Analytic geometry</span> Study of geometry using a coordinate system

In mathematics, analytic geometry, also known as coordinate geometry or Cartesian geometry, is the study of geometry using a coordinate system. This contrasts with synthetic geometry.

<span class="mw-page-title-main">Asymptote</span> Limit of the tangent line at a point that tends to infinity

In analytic geometry, an asymptote of a curve is a line such that the distance between the curve and the line approaches zero as one or both of the x or y coordinates tends to infinity. In projective geometry and related contexts, an asymptote of a curve is a line which is tangent to the curve at a point at infinity.

<span class="mw-page-title-main">Hyperbola</span> Plane curve: conic section

In mathematics, a hyperbola is a type of smooth curve lying in a plane, defined by its geometric properties or by equations for which it is the solution set. A hyperbola has two pieces, called connected components or branches, that are mirror images of each other and resemble two infinite bows. The hyperbola is one of the three kinds of conic section, formed by the intersection of a plane and a double cone. If the plane intersects both halves of the double cone but does not pass through the apex of the cones, then the conic is a hyperbola.

<span class="mw-page-title-main">Parabola</span> Plane curve: conic section

In mathematics, a parabola is a plane curve which is mirror-symmetrical and is approximately U-shaped. It fits several superficially different mathematical descriptions, which can all be proved to define exactly the same curves.

<span class="mw-page-title-main">Perpendicular</span> Relationship between two lines that meet at a right angle (90 degrees)

In elementary geometry, two geometric objects are perpendicular if they intersect at a right angle. The condition of perpendicularity may be represented graphically using the perpendicular symbol, ⟂. It can be defined between two lines, between a line and a plane, and between two planes.

<span class="mw-page-title-main">Nine-point circle</span> Circle constructed from a triangle

In geometry, the nine-point circle is a circle that can be constructed for any given triangle. It is so named because it passes through nine significant concyclic points defined from the triangle. These nine points are:

<span class="mw-page-title-main">Centroid</span> Mean ("average") position of all the points in a shape

In mathematics and physics, the centroid, also known as geometric center or center of figure, of a plane figure or solid figure is the arithmetic mean position of all the points in the surface of the figure. The same definition extends to any object in n-dimensional Euclidean space.

<span class="mw-page-title-main">Tractrix</span> Curve traced by a point on a rod as one end is dragged along a line

In geometry, a tractrix is the curve along which an object moves, under the influence of friction, when pulled on a horizontal plane by a line segment attached to a pulling point that moves at a right angle to the initial line between the object and the puller at an infinitesimal speed. It is therefore a curve of pursuit. It was first introduced by Claude Perrault in 1670, and later studied by Isaac Newton (1676) and Christiaan Huygens (1693).

<span class="mw-page-title-main">Line (geometry)</span> Straight figure with zero width and depth

In geometry, a line is an infinitely long object with no width, depth, or curvature. Thus, lines are one-dimensional objects, though they may exist in two, three, or higher dimension spaces. The word line may also refer to a line segment in everyday life, which has two points to denote its ends. Lines can be referred by two points that lay on it or by a single letter.

<span class="mw-page-title-main">Hyperbolic orthogonality</span> Relation of space and time in relativity theory

In geometry, the relation of hyperbolic orthogonality between two lines separated by the asymptotes of a hyperbola is a concept used in special relativity to define simultaneous events. Two events will be simultaneous when they are on a line hyperbolically orthogonal to a particular time line. This dependence on a certain time line is determined by velocity, and is the basis for the relativity of simultaneity.

<span class="mw-page-title-main">Cross section (geometry)</span> Projection of a solid body onto a plane in 3D space, or an intersection of the two

In geometry and science, a cross section is the non-empty intersection of a solid body in three-dimensional space with a plane, or the analog in higher-dimensional spaces. Cutting an object into slices creates many parallel cross-sections. The boundary of a cross-section in three-dimensional space that is parallel to two of the axes, that is, parallel to the plane determined by these axes, is sometimes referred to as a contour line; for example, if a plane cuts through mountains of a raised-relief map parallel to the ground, the result is a contour line in two-dimensional space showing points on the surface of the mountains of equal elevation.

In geometry, lines in a plane or higher-dimensional space are said to be concurrent if they intersect at a single point. They are in contrast to parallel lines.

In geometry, collinearity of a set of points is the property of their lying on a single line. A set of points with this property is said to be collinear. In greater generality, the term has been used for aligned objects, that is, things being "in a line" or "in a row".

<span class="mw-page-title-main">Asymptote (vector graphics language)</span>

Asymptote is a descriptive vector graphics language — developed by Andy Hammerlindl, John C. Bowman, and Tom Prince — which provides a natural coordinate-based framework for technical drawing. Asymptote runs on all major platforms. It is free software, available under the terms of the GNU Lesser General Public License (LGPL).

<span class="mw-page-title-main">Centre (geometry)</span> Middle of the object in geometry

In geometry, a centre of an object is a point in some sense in the middle of the object. According to the specific definition of center taken into consideration, an object might have no center. If geometry is regarded as the study of isometry groups, then a center is a fixed point of all the isometries that move the object onto itself.

<span class="mw-page-title-main">CaRMetal</span> Interactive geometry program

CaRMetal is an interactive geometry program which inherited the C.a.R. engine. The software has been created by Eric Hakenholz, in Java. CaRMetal is free, under GNU GPL license. It keeps an amount of functionality of C.a.R. but uses a different graphical interface which purportedly eliminates some intermediate dialogs and provides direct access to numerous effects. Constructions are done using a main palette, which contains some useful construction shortcuts in addition to the standard compass and ruler tools. These include perpendicular bisector, circle through three points, circumcircular arc through three points, and conic section through five points. Also interesting are the loci, functions, parametric curves, and implicit plots. Element thickness, color, label, and other attributes can be set using a separate panel.

<span class="mw-page-title-main">Conic section</span> Curve from a cone intersecting a plane

A conic section, conic or a quadratic curve is a curve obtained from a cone's surface intersecting a plane. The three types of conic section are the hyperbola, the parabola, and the ellipse; the circle is a special case of the ellipse, though it was sometimes called as a fourth type. The ancient Greek mathematicians studied conic sections, culminating around 200 BC with Apollonius of Perga's systematic work on their properties.

<span class="mw-page-title-main">Unit hyperbola</span> Geometric figure

In geometry, the unit hyperbola is the set of points (x,y) in the Cartesian plane that satisfy the implicit equation In the study of indefinite orthogonal groups, the unit hyperbola forms the basis for an alternative radial length

<span class="mw-page-title-main">DrGeo</span>

GNU Dr. Geo is interactive geometry software that allows its users to design & manipulate interactive geometric sketches. It is free software, created by Hilaire Fernandes, it is part of the GNU project. It runs over a Morphic graphic system. Current version of Dr. Geo is also called Dr. Geo II. Historically Dr. Geo was developed in C++ and Dr. Geo II is a complete rewrite using Pharo that happened in 2005. This article refers to the most recent version.