gnuplot is a command-line and GUI program that can generate two- and three-dimensional plots of functions, data, and data fits. The program runs on all major computers and operating systems (Linux, Unix, Microsoft Windows, macOS, FreeDOS, and many others).[4] Originally released in 1986, its listed authors are Thomas Williams, Colin Kelley, Russell Lang, Dave Kotz, John Campbell, Gershon Elber, Alexander Woo "and many others."[5] Despite its name, this software is not part of the GNU Project.
gnuplot can produce output directly on screen, or in many formats of graphics files, including Portable Network Graphics (PNG), Encapsulated PostScript (EPS), Scalable Vector Graphics (SVG), JPEG and many others. It is also capable of producing LaTeX code that can be included directly in LaTeX documents, making use of LaTeX's fonts and powerful formula notation abilities. The program can be used both interactively and in batch mode using scripts.[6]
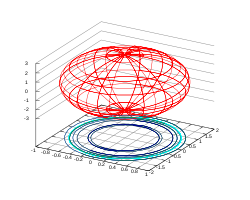
gnuplot can read data in multiple formats, including ability to read data on the fly generated by other programs (piping), create multiple plots on one image, do 2D, 3D, contour plots, parametric equations, supports various linear and non-linear coordinate systems, projections, geographic and time data reading and presentation, box plots of various forms, histograms, labels, and other custom elements on the plot, including shapes, text and images, that can be set manually, computed by script or automatically from input data.
gnuplot also provides scripting capabilities, looping, functions, text processing, variables, macros, arbitrary pre-processing of input data (usually across columns), as well as the ability to perform non-linear multi-dimensional multi-set weighted data fitting (see Curve fitting and Levenberg–Marquardt algorithm).
The gnuplot core code is programmed in C. Modular subsystems for output via Qt, wxWidgets, and LaTeX/TikZ/ConTeXt are written in C++ and Lua.
gnuplot in interactive use
The code below creates the graph to the right.
settitle"Some Math Functions"setxrange[-10:10]setyrange[-2:2]setzeroaxisplot(x/4)**2,sin(x),1/x
The name of this program was originally chosen to avoid conflicts with a program called "newplot", and was originally a compromise between "llamaplot" and "nplot".[7]
Support of Epidemic daily and weekly formats in Version 5.4.2 is a result of pandemic Coronavirus data needs.[8]
Despite gnuplot's name, it is not named after, part of or related to the GNU Project, nor does it use the GNU General Public License. It was named as part of a compromise by the original authors, punning on gnu (the animal) and newplot (a planned name that was discarded due to already being used).[10]
Official source code to gnuplot is freely redistributable, but modified versions thereof are not. The gnuplot license allows instead distribution of patches against official releases, optionally accompanied by officially released source code. Binaries may be distributed along with the unmodified source code and any patches applied thereto. Contact information must be supplied with derived works for technical support for the modified software.[3]
Permission to modify the software is granted, but not the right to distribute the complete modified source code. Modifications are to be distributed as patches to the released version.
Newer gnuplot modules (e.g. Qt, wxWidgets, and cairo drivers) have been contributed under dual-licensing terms, e.g. gnuplot + BSD or gnuplot + GPL.[citation needed]
GUIs and programs that use gnuplot
Several third-party programs have graphical user interfaces that can be used to generate graphs using gnuplot as the plotting engine. These include:
gnuplot also supports piping, which is typical of scripts.[23] For script-driven graphics, gnuplot is one of the most popular programs.[citation needed]
Gnuplot output formats
Gnuplot allows the user to display or store plots in several ways:[24][25]
This page is based on this Wikipedia article Text is available under the CC BY-SA 4.0 license; additional terms may apply. Images, videos and audio are available under their respective licenses.

 A scatter plot of samples from a text file
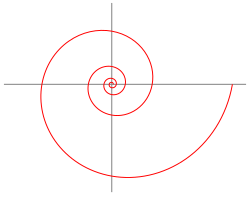 A logarithmic spiral