Related Research Articles

Energy policies are the government's strategies and decisions regarding the production, distribution, and consumption of energy within a specific jurisdiction. Energy is essential for the functioning of modern economies because they require energy for many sectors, such as industry, transport, agriculture, housing. The main components of energy policy include legislation, international treaties, energy subsidies and other public policy techniques.
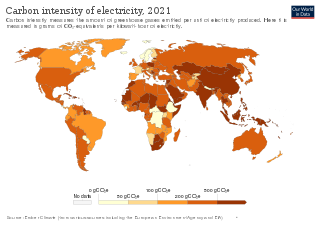
An emission intensity is the emission rate of a given pollutant relative to the intensity of a specific activity, or an industrial production process; for example grams of carbon dioxide released per megajoule of energy produced, or the ratio of greenhouse gas emissions produced to gross domestic product (GDP). Emission intensities are used to derive estimates of air pollutant or greenhouse gas emissions based on the amount of fuel combusted, the number of animals in animal husbandry, on industrial production levels, distances traveled or similar activity data. Emission intensities may also be used to compare the environmental impact of different fuels or activities. In some case the related terms emission factor and carbon intensity are used interchangeably. The jargon used can be different, for different fields/industrial sectors; normally the term "carbon" excludes other pollutants, such as particulate emissions. One commonly used figure is carbon intensity per kilowatt-hour (CIPK), which is used to compare emissions from different sources of electrical power.

Climate change mitigation (or decarbonisation) is action to limit the greenhouse gases in the atmosphere that cause climate change. Climate change mitigation actions include conserving energy and replacing fossil fuels with clean energy sources. Secondary mitigation strategies include changes to land use and removing carbon dioxide (CO2) from the atmosphere. Current climate change mitigation policies are insufficient as they would still result in global warming of about 2.7 °C by 2100, significantly above the 2015 Paris Agreement's goal of limiting global warming to below 2 °C.
Clean technology, also called cleantech or climatetech, is any process, product, or service that reduces negative environmental impacts through significant energy efficiency improvements, the sustainable use of resources, or environmental protection activities. Clean technology includes a broad range of technology related to recycling, renewable energy, information technology, green transportation, electric motors, green chemistry, lighting, grey water, and more. Environmental finance is a method by which new clean technology projects can obtain financing through the generation of carbon credits. A project that is developed with concern for climate change mitigation is also known as a carbon project.

Energy in the United Kingdom came mostly from fossil fuels in 2021. Total energy consumption in the United Kingdom was 142.0 million tonnes of oil equivalent in 2019. In 2014, the UK had an energy consumption per capita of 2.78 tonnes of oil equivalent compared to a world average of 1.92 tonnes of oil equivalent. Demand for electricity in 2023 was 29.6 GW on average, supplied through 235 TWh of UK-based generation and 24 TWh of energy imports.

A low-carbon economy (LCE) is an economy which absorbs as much greenhouse gas as it emits. Greenhouse gas (GHG) emissions due to human activity are the dominant cause of observed climate change since the mid-20th century. There are many proven approaches for moving to a low-carbon economy, such as encouraging renewable energy transition, energy conservation, electrification of transportation, and carbon capture and storage. An example are zero-carbon cities.
The Investor Network on Climate Risk (INCR) is a nonprofit organization of investors and financial institutions that promotes better understanding of the financial risks and investment opportunities posed by climate change. INCR is coordinated by Ceres, a coalition of investors and environmental groups working to advance sustainable prosperity.
Energy planning has a number of different meanings, but the most common meaning of the term is the process of developing long-range policies to help guide the future of a local, national, regional or even the global energy system. Energy planning is often conducted within governmental organizations but may also be carried out by large energy companies such as electric utilities or oil and gas producers. These oil and gas producers release greenhouse gas emissions. Energy planning may be carried out with input from different stakeholders drawn from government agencies, local utilities, academia and other interest groups.

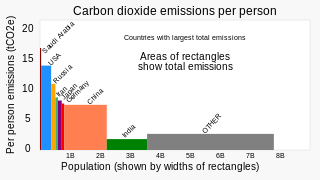
Greenhouse gas (GHG) emissions from human activities intensify the greenhouse effect. This contributes to climate change. Carbon dioxide, from burning fossil fuels such as coal, oil, and natural gas, is one of the most important factors in causing climate change. The largest emitters are China followed by the United States. The United States has higher emissions per capita. The main producers fueling the emissions globally are large oil and gas companies. Emissions from human activities have increased atmospheric carbon dioxide by about 50% over pre-industrial levels. The growing levels of emissions have varied, but have been consistent among all greenhouse gases. Emissions in the 2010s averaged 56 billion tons a year, higher than any decade before. Total cumulative emissions from 1870 to 2022 were 703 GtC, of which 484±20 GtC from fossil fuels and industry, and 219±60 GtC from land use change. Land-use change, such as deforestation, caused about 31% of cumulative emissions over 1870–2022, coal 32%, oil 24%, and gas 10%.

The United States produced 5.2 billion metric tons of carbon dioxide equivalent greenhouse gas (GHG) emissions in 2020, the second largest in the world after greenhouse gas emissions by China and among the countries with the highest greenhouse gas emissions per person. In 2019 China is estimated to have emitted 27% of world GHG, followed by the United States with 11%, then India with 6.6%. In total the United States has emitted a quarter of world GHG, more than any other country. Annual emissions are over 15 tons per person and, amongst the top eight emitters, is the highest country by greenhouse gas emissions per person.
Carbon leakage a concept to quantify an increase in greenhouse gas emissions in one country as a result of an emissions reduction by a second country with stricter climate change mitigation policies. Carbon leakage is one type of spill-over effect. Spill-over effects can be positive or negative; for example, emission reductions policy might lead to technological developments that aid reductions outside of the policy area. Carbon leakage is defined as "the increase in CO2 emissions outside the countries taking domestic mitigation action divided by the reduction in the emissions of these countries." It is expressed as a percentage, and can be greater or less than 100%. There is no consensus over the magnitude of long-term leakage effects.

Carbon emission trading (also called carbon market, emission trading scheme (ETS) or cap and trade) is a type of emissions trading scheme designed for carbon dioxide (CO2) and other greenhouse gases (GHGs). A form of carbon pricing, its purpose is to limit climate change by creating a market with limited allowances for emissions. Carbon emissions trading is a common method that countries use to attempt to meet their pledges under the Paris Agreement, with schemes operational in China, the European Union, and other countries.
Abatement cost is the cost of reducing environmental negatives such as pollution. Marginal cost is an economic concept that measures the cost of an additional unit. The marginal abatement cost, in general, measures the cost of reducing one more unit of pollution. Marginal abatement costs are also called the "marginal cost" of reducing such environmental negatives.

The economics of climate change mitigation is a contentious part of climate change mitigation – action aimed to limit the dangerous socio-economic and environmental consequences of climate change.

In 2021, net greenhouse gas (GHG) emissions in the United Kingdom (UK) were 427 million tonnes (Mt) carbon dioxide equivalent, 80% of which was carbon dioxide itself. Emissions increased by 5% in 2021 with the easing of COVID-19 restrictions, primarily due to the extra road transport. The UK has over time emitted about 3% of the world total human caused CO2, with a current rate under 1%, although the population is less than 1%.

Green economy policies in Canada are policies that contribute to transitioning the Canadian economy to a more environmentally sustainable one. The green economy can be defined as an economy, "that results in improved human well-being and social equity, while significantly reducing environmental risks and ecological scarcities." Aspects of a green economy would include stable growth in income and employment that is driven by private and public investment into policies and actions that reduce carbon emissions, pollution and prevent the loss of biodiversity.

Coal, cars and lorries vent more than a third of Turkey's six hundred million tonnes of annual greenhouse gas emissions, which are mostly carbon dioxide and part of the cause of climate change in Turkey. The nation's coal-fired power stations emit the most carbon dioxide, and other significant sources are road vehicles running on petrol or diesel. After coal and oil the third most polluting fuel is fossil gas; which is burnt in Turkey's gas-fired power stations, homes and workplaces. Much methane is belched by livestock; cows alone produce half of the greenhouse gas from agriculture in Turkey.
China's greenhouse gas emissions are the largest of any country in the world both in production and consumption terms, and stem mainly from coal burning, including coal power, coal mining, and blast furnaces producing iron and steel. When measuring production-based emissions, China emitted over 14 gigatonnes (Gt) CO2eq of greenhouse gases in 2019, 27% of the world total. When measuring in consumption-based terms, which adds emissions associated with imported goods and extracts those associated with exported goods, China accounts for 13 gigatonnes (Gt) or 25% of global emissions. According to the Carbon Majors Database, Chinese state coal production alone accounts for 14% of historic global emissions.

Greenhouse gas emissionsbyRussia are mostly from fossil gas, oil and coal. Russia emits 2 or 3 billion tonnes CO2eq of greenhouse gases each year; about 4% of world emissions. Annual carbon dioxide emissions alone are about 12 tons per person, more than double the world average. Cutting greenhouse gas emissions, and therefore air pollution in Russia, would have health benefits greater than the cost. The country is the world's biggest methane emitter, and 4 billion dollars worth of methane was estimated to leak in 2019/20.

World energy supply and consumption refers to the global supply of energy resources and its consumption. The system of global energy supply consists of the energy development, refinement, and trade of energy. Energy supplies may exist in various forms such as raw resources or more processed and refined forms of energy. The raw energy resources include for example coal, unprocessed oil & gas, uranium. In comparison, the refined forms of energy include for example refined oil that becomes fuel and electricity. Energy resources may be used in various different ways, depending on the specific resource, and intended end use. Energy production and consumption play a significant role in the global economy. It is needed in industry and global transportation. The total energy supply chain, from production to final consumption, involves many activities that cause a loss of useful energy.
References
- ↑ Energy Scenarios, Technology Development and Climate Policy Analysis with the POLES Modelling System Archived 2011-08-19 at the Wayback Machine
- ↑ Emissions Constraints and Induced Technical Change in the Energy Sector: simulations with the POLES model
- ↑ Techpol, un observatoire des nouvelles technologies de l'énergie, Menanteau, P., in Lettre Techniques de l'Ingénieur - Energies, 2 (2006) 5-6
- ↑ Enerdata Poles Model
- ↑ "Uses at IPTS". Archived from the original on 2010-05-06. Retrieved 2010-02-11.
- ↑ Coupling with the GEM-E3 model Archived 2006-10-01 at the Wayback Machine
- ↑ Greenhouse gas reduction pathways in the UNFCCC process up to 2025 - study for DG ENV
- ↑ World Energy Technology Outlook 2050 Archived 2010-07-15 at the Wayback Machine - study for DG RTD
- ↑ Facteur 4 Archived 2006-11-27 at the Wayback Machine - study for the French ministry of finance and industry
- ↑ Sustainable paths for EU increased climate and energy ambition Enel study
- ↑ Costs and Benefits to EU Member States of 2030 Climate and Energy Targets
- ↑ Sharing developed countries’ post-2012 greenhouse gas emission reductions based on comparable efforts Archived 2011-07-10 at the Wayback Machine
- ↑ Economic Assessment of Post-2012 Global Climate Policies using POLES and GEM-E3
| Models | |
|---|---|
| Open data | |
| Lists | |
| Concepts | |
| Applications | |
| People | |
| Organizations | |