Related Research Articles
In survival analysis, the hazard ratio (HR) is the ratio of the hazard rates corresponding to the conditions characterised by two distinct levels of a treatment variable of interest. For example, in a clinical study of a drug, the treated population may die at twice the rate per unit time of the control population. The hazard ratio would be 2, indicating higher hazard of death from the treatment.
In statistics, an effect size is a value measuring the strength of the relationship between two variables in a population, or a sample-based estimate of that quantity. It can refer to the value of a statistic calculated from a sample of data, the value of a parameter for a hypothetical population, or to the equation that operationalizes how statistics or parameters lead to the effect size value. Examples of effect sizes include the correlation between two variables, the regression coefficient in a regression, the mean difference, or the risk of a particular event happening. Effect sizes complement statistical hypothesis testing, and play an important role in power analyses, sample size planning, and in meta-analyses. The cluster of data-analysis methods concerning effect sizes is referred to as estimation statistics.

A case–control study is a type of observational study in which two existing groups differing in outcome are identified and compared on the basis of some supposed causal attribute. Case–control studies are often used to identify factors that may contribute to a medical condition by comparing subjects who have that condition/disease with patients who do not have the condition/disease but are otherwise similar. They require fewer resources but provide less evidence for causal inference than a randomized controlled trial. A case–control study is often used to produce an odds ratio, which is an inferior measure of strength of association compared to relative risk, but new statistical methods make it possible to use a case-control study to estimate relative risk, risk differences, and other quantities.
In epidemiology, a risk factor or determinant is a variable associated with an increased risk of disease or infection.
In medical research, social science, and biology, a cross-sectional study is a type of observational study that analyzes data from a population, or a representative subset, at a specific point in time—that is, cross-sectional data.
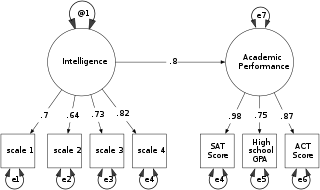
Structural equation modeling (SEM) is a diverse set of methods used by scientists doing both observational and experimental research. SEM is used mostly in the social and behavioral sciences but it is also used in epidemiology, business, and other fields. A definition of SEM is difficult without reference to technical language, but a good starting place is the name itself.

The relative risk (RR) or risk ratio is the ratio of the probability of an outcome in an exposed group to the probability of an outcome in an unexposed group. Together with risk difference and odds ratio, relative risk measures the association between the exposure and the outcome.
A nested case–control (NCC) study is a variation of a case–control study in which cases and controls are drawn from the population in a fully enumerated cohort.
Relative survival of a disease, in survival analysis, is calculated by dividing the overall survival after diagnosis by the survival as observed in a similar population not diagnosed with that disease. A similar population is composed of individuals with at least age and gender similar to those diagnosed with the disease.

In epidemiology, Mendelian randomization is a method using measured variation in genes to interrogate the causal effect of an exposure on an outcome. Under key assumptions, the design reduces both reverse causation and confounding, which often substantially impede or mislead the interpretation of results from epidemiological studies.

Socioeconomic status (SES) is an economic and sociological combined total measure of a person's work experience and of an individual's or family's economic access to resources and social position in relation to others. When analyzing a family's SES, the household income, earners' education, and occupation are examined, as well as combined income, whereas for an individual's SES only their own attributes are assessed. Recently, research has revealed a lesser recognized attribute of SES as perceived financial stress, as it defines the "balance between income and necessary expenses". Perceived financial stress can be tested by deciphering whether a person at the end of each month has more than enough, just enough, or not enough money or resources. However, SES is more commonly used to depict an economic difference in society as a whole.
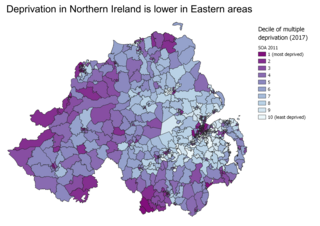
Indices of multiple deprivation (IMD) are widely-used datasets within the UK to classify the relative deprivation of small areas. Multiple components of deprivation are weighted with different strengths and compiled into a single score of deprivation.
Cognitive epidemiology is a field of research that examines the associations between intelligence test scores and health, more specifically morbidity and mortality. Typically, test scores are obtained at an early age, and compared to later morbidity and mortality. In addition to exploring and establishing these associations, cognitive epidemiology seeks to understand causal relationships between intelligence and health outcomes. Researchers in the field argue that intelligence measured at an early age is an important predictor of later health and mortality differences.
Population impact measures (PIMs) are biostatistical measures of risk and benefit used in epidemiological and public health research. They are used to describe the impact of health risks and benefits in a population, to inform health policy.

The correlates of crime explore the associations of specific non-criminal factors with specific crimes.
In 1995, Jo C. Phelan and Bruce G. Link developed the theory of fundamental causes. This theory seeks to outline why the association between socioeconomic status (SES) and health disparities has persisted over time, particularly when diseases and conditions previously thought to cause morbidity and mortality among low SES individuals have resolved. The theory states that an ongoing association exists between SES and health status because SES "embodies an array of resources, such as money, knowledge, prestige, power, and beneficial social connections that protect health no matter what mechanisms are relevant at any given time." In other words, despite advances in screening techniques, vaccinations, or any other piece of health technology or knowledge, the underlying fact is that those from low SES communities lack resources to protect and/or improve their health.
In statistics, linear regression is a linear approach for modelling the relationship between a scalar response and one or more explanatory variables. The case of one explanatory variable is called simple linear regression; for more than one, the process is called multiple linear regression. This term is distinct from multivariate linear regression, where multiple correlated dependent variables are predicted, rather than a single scalar variable.

Olive Jean Dunn was an American mathematician and statistician, and professor of biostatistics at the University of California Los Angeles (UCLA). She described methods for computing confidence intervals and also codified the Bonferroni correction's application to confidence intervals. She authored the textbook Basic Statistics: A Primer for the Biomedical Sciences in 1977.
Biological inequity, also known as biological inequality, refers to “systematic, unfair, and avoidable stress-related biological differences which increase risk of disease, observed between social groups of a population”. The term developed by Centric Lab aims to unify societal factors with the biological underpinnings of health inequities – the unfair and avoidable differences in health status and risks between social groups of a population - such that these inequalities can be investigated in a holistic manner.
References
- ↑ Mackenbach, Johan; Anton Kunst (1997). "Measuring the magnitude of socio-economic inequalities in health: An overview of available measures illustrated with two examples from Europe". Social Science & Medicine. 44 (6): 757–771. doi:10.1016/S0277-9536(96)00073-1. PMID 9080560.
- 1 2 Batty, David; Geoff Der; Sally Macintyre; Ian Deary (2006). "Does IQ explain socioeconomic inequalities in health? Evidence from a population based cohort study in the west of Scotland". BMJ. 332 (7541): 580–584. doi:10.1136/bmj.38723.660637.AE. PMC 1397779 . PMID 16452104.