This is a list of the results of the 1905 state election in Western Australia, listed by electoral district.
Party | Candidate | Votes | % | ±% | |
---|---|---|---|---|---|
Ministerial | Edward Barnett | 674 | 55.1 | +55.1 | |
Ministerial | Charles Keyser | 550 | 44.9 | –6.5 | |
Total formal votes | 1,224 | 99.1 | +2.2 | ||
Informal votes | 11 | 0.9 | –2.2 | ||
Turnout | 1,241 | 45.8 | +1.7 | ||
Ministerial hold | Swing | N/A | |||
Party | Candidate | Votes | % | ±% | |
---|---|---|---|---|---|
Ministerial | John Veryard | 768 | 55.4 | +38.9 | |
Labour | Frederick Gill | 619 | 44.6 | –11.9 | |
Total formal votes | 1,387 | 99.4 | +0.9 | ||
Informal votes | 8 | 0.6 | –0.9 | ||
Turnout | 1,395 | 57.7 | +7.5 | ||
Ministerial gain from Labour | Swing | +38.9 |
Party | Candidate | Votes | % | ±% | |
---|---|---|---|---|---|
Ministerial | Edmund Smith | 325 | 44.3 | +44.3 | |
Ministerial | George Ricks | 183 | 25.0 | +25.0 | |
Ministerial | Francis McDonald | 179 | 24.4 | +24.4 | |
Ministerial | Hugh Edmiston | 46 | 6.3 | –40.3 | |
Total formal votes | 733 | 99.3 | –0.1 | ||
Informal votes | 5 | 0.7 | +0.1 | ||
Turnout | 738 | 51.5 | +4.4 | ||
Ministerial gain from Independent | Swing | N/A |
Party | Candidate | Votes | % | ±% | |
---|---|---|---|---|---|
Labour | Philip Collier | 872 | 46.8 | +8.3 | |
Ministerial | John Hopkins | 853 | 45.7 | –15.8 | |
Total formal votes | 1,865 | 99.6 | –0.1 | ||
Informal votes | 8 | 0.4 | +0.1 | ||
Turnout | 1,880 | 69.1 | +9.0 | ||
Labour gain from Ministerial | Swing | +8.3 |
Party | Candidate | Votes | % | ±% | |
---|---|---|---|---|---|
Labour | Thomas Bath | 1,093 | 69.3 | –30.7 | |
Independent | Richard White | 484 | 30.7 | +30.7 | |
Total formal votes | 1,577 | 99.6 | n/a | ||
Informal votes | 7 | 0.4 | n/a | ||
Turnout | 1,584 | 57.9 | n/a | ||
Labour hold | Swing | –30.7 | |||
Party | Candidate | Votes | % | ±% | |
---|---|---|---|---|---|
Ministerial | Newton Moore | unopposed | |||
Ministerial hold | Swing | ||||
Party | Candidate | Votes | % | ±% | |
---|---|---|---|---|---|
Ministerial | William Gordon | 643 | 50.6 | +5.3 | |
Independent | James Milligan | 496 | 39.1 | +14.5 | |
Ministerial | Joseph Charles | 131 | 10.3 | +10.3 | |
Total formal votes | 1,270 | 99.9 | +1.0 | ||
Informal votes | 1 | 0.1 | –1.0 | ||
Turnout | 1,271 | 45.0 | –9.0 | ||
Ministerial hold | Swing | N/A | |||
Party | Candidate | Votes | % | ±% | |
---|---|---|---|---|---|
Ministerial | John Foulkes | 1,064 | 71.3 | –11.1 | |
Ministerial | James Weir | 428 | 28.7 | +28.7 | |
Total formal votes | 1,492 | 99.3 | +2.0 | ||
Informal votes | 10 | 0.7 | –2.0 | ||
Turnout | 1,502 | 45.6 | –13.9 | ||
Ministerial hold | Swing | N/A | |||
Party | Candidate | Votes | % | ±% | |
---|---|---|---|---|---|
Ministerial | John Ewing | 600 | 54.0 | +13.5 | |
Labour | Ernest Henshaw | 511 | 46.0 | –13.5 | |
Total formal votes | 1,111 | 99.9 | +1.3 | ||
Informal votes | 1 | 0.1 | –1.3 | ||
Turnout | 1,112 | 49.8 | +0.8 | ||
Ministerial gain from Labour | Swing | +13.5 |
Party | Candidate | Votes | % | ±% | |
---|---|---|---|---|---|
Ministerial | William Eddy | 544 | 36.0 | –5.5 | |
Labour | Charles McDowall | 521 | 34.5 | –24.0 | |
Independent Labour | Henry Ellis | 446 | 29.5 | +29.5 | |
Total formal votes | 1,511 | 96.3 | –2.9 | ||
Informal votes | 58 | 0.8 | +2.9 | ||
Turnout | 1,569 | 56.3 | –3.4 | ||
Ministerial gain from Independent Labour | Swing | –5.5 |
Party | Candidate | Votes | % | ±% | |
---|---|---|---|---|---|
Labour | Edward Heitmann | 624 | 51.4 | –5.0 | |
Ministerial | James Chesson | 590 | 48.6 | +5.0 | |
Total formal votes | 1,214 | 98.9 | –0.5 | ||
Informal votes | 13 | 1.1 | +0.5 | ||
Turnout | 1,218 | 51.6 | –6.9 | ||
Labour hold | Swing | –5.0 | |||
Party | Candidate | Votes | % | ±% | |
---|---|---|---|---|---|
Labour | Charles Hudson | 382 | 38.3 | –7.7 | |
Independent | Albert Thomas | 370 | 37.1 | –16.9 | |
Independent Labour | Robert Stewart | 245 | 24.6 | +24.6 | |
Total formal votes | 997 | 98.7 | –0.5 | ||
Informal votes | 13 | 1.3 | +0.5 | ||
Turnout | 1,010 | 61.5 | –3.3 | ||
Labour gain from Independent | Swing | –5.5 |
Party | Candidate | Votes | % | ±% | |
---|---|---|---|---|---|
Ministerial | Joseph Holmes | 1,019 | 50.5 | +3.5 | |
Labour | William Angwin | 999 | 49.5 | –3.5 | |
Total formal votes | 2,018 | 99.7 | +0.1 | ||
Informal votes | 5 | 0.3 | –0.1 | ||
Turnout | 2,023 | 65.2 | +9.5 | ||
Ministerial gain from Labour | Swing | –3.5 |
Party | Candidate | Votes | % | ±% | |
---|---|---|---|---|---|
Ministerial | John Hardwick | 1,090 | 50.7 | –4.6 | |
Labour | Joseph Fabre | 621 | 28.9 | –15.8 | |
Ministerial | Frank Smalpage | 437 | 20.3 | +20.3 | |
Total formal votes | 2,148 | 99.0 | ±0.0 | ||
Informal votes | 22 | 1.0 | ±0.0 | ||
Turnout | 2,170 | 48.6 | +15.8 | ||
Ministerial hold | Swing | N/A | |||
Party | Candidate | Votes | % | ±% | |
---|---|---|---|---|---|
Labour | Albert Wilson | unopposed | |||
Labour hold | Swing | ||||
Party | Candidate | Votes | % | ±% | |
---|---|---|---|---|---|
Ministerial | James Price | 744 | 52.5 | +3.3 | |
Labour | Ted Needham | 674 | 47.5 | –3.3 | |
Total formal votes | 1,418 | 98.1 | –0.7 | ||
Informal votes | 28 | 1.9 | +0.7 | ||
Turnout | 1,446 | 61.9 | +28.7 | ||
Ministerial gain from Labour | Swing | +3.3 |
Party | Candidate | Votes | % | ±% | |
---|---|---|---|---|---|
Ministerial | William Butcher | unopposed | |||
Ministerial hold | Swing | ||||
Party | Candidate | Votes | % | ±% | |
---|---|---|---|---|---|
Ministerial | Henry Carson | 577 | 51.2 | +6.2 | |
Labour | Thomas Brown | 551 | 48.8 | +5.8 | |
Total formal votes | 1,128 | 99.0 | +0.3 | ||
Informal votes | 11 | 1.0 | –0.3 | ||
Turnout | 1,139 | 71.8 | +3.3 | ||
Ministerial hold | Swing | N/A | |||
Party | Candidate | Votes | % | ±% | |
---|---|---|---|---|---|
Independent National | Patrick Stone | 314 | 45.0 | +14.4 | |
Ministerial | Edward Harney | 235 | 33.7 | +33.7 | |
Ministerial | Henry Maley | 149 | 21.4 | +21.4 | |
Total formal votes | 698 | 98.6 | +0.4 | ||
Informal votes | 10 | 1.4 | –0.4 | ||
Turnout | 708 | 55.5 | –6.7 | ||
Independent National gain from Ministerial | Swing | +14.4 |
Party | Candidate | Votes | % | ±% | |
---|---|---|---|---|---|
Ministerial | Hector Rason | unopposed | |||
Ministerial hold | Swing | ||||
Party | Candidate | Votes | % | ±% | |
---|---|---|---|---|---|
Labour | Francis Ware | 1,519 | 74.2 | +8.8 | |
Ministerial | Robert Boylen | 529 | 25.8 | +25.8 | |
Total formal votes | 2,041 | 98.6 | –1.2 | ||
Informal votes | 29 | 1.4 | +1.2 | ||
Turnout | 2,070 | 55.5 | +9.2 | ||
Labour hold | Swing | +8.8 | |||
Party | Candidate | Votes | % | ±% | |
---|---|---|---|---|---|
Ministerial | Samuel Moore | unopposed | |||
Ministerial hold | Swing | ||||
Party | Candidate | Votes | % | ±% | |
---|---|---|---|---|---|
Labour | John Scaddan | unopposed | |||
Labour hold | Swing | ||||
Party | Candidate | Votes | % | ±% | |
---|---|---|---|---|---|
Independent National | Norbert Keenan | 1,629 | 60.9 | +13.0 | |
Labour | William Johnson | 1,045 | 39.1 | –13.0 | |
Total formal votes | 2,674 | 99.2 | –0.4 | ||
Informal votes | 21 | 0.8 | +0.4 | ||
Turnout | 2,695 | 72.9 | +14.0 | ||
Independent National gain from Labour | Swing | +13.0 |
Party | Candidate | Votes | % | ±% | |
---|---|---|---|---|---|
Labour | Thomas Walker | 965 | 68.9 | –31.1 | |
Ministerial | Henry Field | 435 | 31.1 | +31.1 | |
Total formal votes | 1,400 | 99.1 | n/a | ||
Informal votes | 13 | 0.9 | n/a | ||
Turnout | 1,413 | 47.9 | n/a | ||
Labour hold | Swing | –31.1 | |||
Party | Candidate | Votes | % | ±% | |
---|---|---|---|---|---|
Ministerial | Frederick Henry Piesse | unopposed | |||
Ministerial hold | Swing | n/a | |||
Party | Candidate | Votes | % | ±% | |
---|---|---|---|---|---|
Ministerial | Arthur Male | 263 | 55.5 | +55.5 | |
Independent | Francis Connor | 211 | 44.5 | –6.6 | |
Total formal votes | 474 | 99.2 | –0.3 | ||
Informal votes | 4 | 0.8 | +0.3 | ||
Turnout | 478 | 42.5 | –6.9 | ||
Ministerial gain from Independent | Swing | +55.5 |
Party | Candidate | Votes | % | ±% | |
---|---|---|---|---|---|
Ministerial | Henry Gregory | 874 | 52.5 | –6.6 | |
Labour | Richard Buzacott | 790 | 47.5 | +6.6 | |
Total formal votes | 1,664 | 99.3 | n/a | ||
Informal votes | 11 | 0.7 | n/a | ||
Turnout | 1,675 | 67.1 | n/a | ||
Ministerial hold | Swing | –6.6 | |||
Party | Candidate | Votes | % | ±% | |
---|---|---|---|---|---|
Labour | Patrick Lynch | 786 | 67.5 | +0.9 | |
Ministerial | Joseph Semken | 378 | 32.5 | –0.9 | |
Total formal votes | 1,204 | 98.5 | n/a | ||
Informal votes | 18 | 1.5 | n/a | ||
Turnout | 1,222 | 67.1 | n/a | ||
Labour hold | Swing | +0.9 | |||
Party | Candidate | Votes | % | ±% | |
---|---|---|---|---|---|
Labour | Frank Troy | 557 | 66.2 | +4.9 | |
Ministerial | George Baxter | 285 | 33.8 | –4.9 | |
Total formal votes | 842 | 98.6 | –2.8 | ||
Informal votes | 12 | 1.4 | +2.8 | ||
Turnout | 854 | 45.4 | –3.2 | ||
Labour hold | Swing | +4.9 | |||
Party | Candidate | Votes | % | ±% | |
---|---|---|---|---|---|
Labour | George Taylor | 738 | 53.9 | –46.1 | |
Ministerial | John Smith | 323 | 23.6 | +23.6 | |
Labour | Thomas Campbell | 309 | 22.5 | +22.5 | |
Total formal votes | 1,370 | 99.0 | n/a | ||
Informal votes | 14 | 1.0 | n/a | ||
Turnout | 1,384 | 29.7 | n/a | ||
Labour hold | Swing | –46.1 | |||
Party | Candidate | Votes | % | ±% | |
---|---|---|---|---|---|
Labour | John Holman | unopposed | |||
Labour hold | Swing | N/A | |||
Party | Candidate | Votes | % | ±% | |
---|---|---|---|---|---|
Ministerial | John McLarty | 452 | 72.8 | +9.6 | |
Ministerial | George Wheatley | 169 | 27.2 | +27.2 | |
Total formal votes | 621 | 98.4 | +0.1 | ||
Informal votes | 10 | 1.6 | –0.1 | ||
Turnout | 628 | 44.1 | –8.9 | ||
Ministerial hold | Swing | N/A | |||
Party | Candidate | Votes | % | ±% | |
---|---|---|---|---|---|
Ministerial | Charles Layman | 556 | 57.3 | +10.7 | |
Ministerial | John Walter | 414 | 42.7 | +42.7 | |
Total formal votes | 970 | 99.5 | +0.4 | ||
Informal votes | 5 | 0.5 | –0.4 | ||
Turnout | 986 | 72.2 | +6.7 | ||
Ministerial hold | Swing | N/A | |||
Party | Candidate | Votes | % | ±% | |
---|---|---|---|---|---|
Ministerial | James Mitchell | 984 | 55.2 | +11.9 | |
Labour | Alfred Watts | 800 | 44.8 | –11.9 | |
Total formal votes | 1,784 | 99.5 | +0.4 | ||
Informal votes | 8 | 0.5 | –0.4 | ||
Turnout | 1,790 | 53.1 | +6.3 | ||
Ministerial gain from Labour | Swing | +11.9 |
Party | Candidate | Votes | % | ±% | |
---|---|---|---|---|---|
Labour | Harry Bolton | 894 | 62.5 | +3.6 | |
Ministerial | Patrick Hevron | 537 | 37.5 | –3.6 | |
Total formal votes | 1,431 | 99.6 | +0.4 | ||
Informal votes | 6 | 0.4 | –0.4 | ||
Turnout | 1,437 | 66.7 | +11.5 | ||
Labour hold | Swing | +3.6 | |||
Party | Candidate | Votes | % | ±% | |
---|---|---|---|---|---|
Ministerial | James Brebber | 1,478 | 61.9 | +40.6 | |
Labour | Francis Wilson | 911 | 38.1 | –8.1 | |
Total formal votes | 2,389 | 99.0 | –0.2 | ||
Informal votes | 25 | 1.0 | +0.2 | ||
Turnout | 2,416 | 48.2 | +7.6 | ||
Ministerial gain from Labour | Swing | +40.6 |
Party | Candidate | Votes | % | ±% | |
---|---|---|---|---|---|
Ministerial | Harry Brown | 567 | 53.0 | –10.0 | |
Independent | Charles Moran | 336 | 31.4 | +31.4 | |
Ministerial | Henry Braidwood | 167 | 15.6 | +15.6 | |
Total formal votes | 1,070 | 98.2 | –0.9 | ||
Informal votes | 20 | 1.8 | +0.9 | ||
Turnout | 1,090 | 62.4 | +34.4 | ||
Ministerial hold | Swing | N/A | |||
Party | Candidate | Votes | % | ±% | |
---|---|---|---|---|---|
Ministerial | James Isdell | unopposed | |||
Ministerial hold | Swing | ||||
Party | Candidate | Votes | % | ±% | |
---|---|---|---|---|---|
Ministerial | John Sydney Hicks | unopposed | |||
Ministerial hold | Swing | ||||
Party | Candidate | Votes | % | ±% | |
---|---|---|---|---|---|
Ministerial | Arthur Diamond | 1,116 | 56.0 | –2.5 | |
Labour | Alick McCallum | 878 | 44.0 | +2.5 | |
Total formal votes | 1,994 | 98.8 | –0.6 | ||
Informal votes | 24 | 1.2 | +0.6 | ||
Turnout | 2,018 | 51.4 | +12.2 | ||
Ministerial hold | Swing | –2.5 | |||
Party | Candidate | Votes | % | ±% | |
---|---|---|---|---|---|
Independent Labour | Henry Daglish | 1,086 | 51.9 | –28.1 | |
Ministerial | Samuel Brown | 1,006 | 48.1 | +48.1 | |
Total formal votes | 2,092 | 99.2 | –0.2 | ||
Informal votes | 17 | 0.8 | +0.2 | ||
Turnout | 2,109 | 61.7 | –10.2 | ||
Independent Labour hold | Swing | N/A | |||
Party | Candidate | Votes | % | ±% | |
---|---|---|---|---|---|
Ministerial | Frank Wilson | 520 | 76.5 | +8.3 | |
Ministerial | James Shekleton | 160 | 23.5 | +23.5 | |
Total formal votes | 680 | 97.0 | n/a | ||
Informal votes | 21 | 3.0 | n/a | ||
Turnout | 701 | 72.5 | n/a | ||
Ministerial hold | Swing | N/A | |||
Party | Candidate | Votes | % | ±% | |
---|---|---|---|---|---|
Ministerial | Arthur Gull | 469 | 51.9 | +51.9 | |
Ministerial | Mathieson Jacoby | 434 | 48.1 | +48.1 | |
Total formal votes | 903 | 99.8 | +0.8 | ||
Informal votes | 2 | 0.2 | –0.8 | ||
Turnout | 906 | 34.4 | –10.3 | ||
Ministerial hold | Swing | N/A | |||
Party | Candidate | Votes | % | ±% | |
---|---|---|---|---|---|
Ministerial | Timothy Quinlan | unopposed | |||
Ministerial hold | Swing | ||||
Party | Candidate | Votes | % | ±% | |
---|---|---|---|---|---|
Ministerial | Thomas Hayward | 458 | 77.2 | +25.7 | |
Labour | Thomas Adams | 167 | 22.8 | +1.4 | |
Total formal votes | 732 | 99.5 | +0.6 | ||
Informal votes | 4 | 0.5 | –0.6 | ||
Turnout | 736 | 42.6 | –5.9 | ||
Ministerial hold | Swing | +25.7 | |||
Party | Candidate | Votes | % | ±% | |
---|---|---|---|---|---|
Ministerial | Frederick Illingworth | 1,276 | 65.4 | +65.4 | |
Ministerial | James Speed | 655 | 33.6 | +33.6 | |
Labour | Robert Norman | 21 | 1.1 | –23.1 | |
Total formal votes | 1,952 | 98.4 | ±0 | ||
Informal votes | 32 | 1.6 | ±0 | ||
Turnout | 1,984 | 49.2 | +9.7 | ||
Ministerial hold | Swing | N/A | |||
Party | Candidate | Votes | % | ±% | |
---|---|---|---|---|---|
Ministerial | Frank Cowcher | 703 | 81.2 | +36.2 | |
Labour | Peter Wedd | 163 | 18.8 | –5.4 | |
Total formal votes | 866 | 98.6 | +0.1 | ||
Informal votes | 12 | 1.4 | –0.1 | ||
Turnout | 878 | 42.6 | –12.0 | ||
Ministerial hold | Swing | +36.2 | |||
Party | Candidate | Votes | % | ±% | |
---|---|---|---|---|---|
Labour | Austin Horan | 517 | 58.7 | –2.9 | |
Independent Labour | Fergie Reid | 364 | 41.3 | +41.3 | |
Total formal votes | 881 | 99.5 | +0.6 | ||
Informal votes | 13 | 0.5 | –0.6 | ||
Turnout | 894 | 43.4 | +13.4 | ||
Labour hold | Swing | –2.9 | |||
Party | Candidate | Votes | % | ±% | |
---|---|---|---|---|---|
Ministerial | Frederick Monger | 315 | 57.4 | –42.6 | |
Ministerial | Hugh Roche | 234 | 42.6 | +42.6 | |
Total formal votes | 549 | 99.6 | n/a | ||
Informal votes | 2 | 0.4 | n/a | ||
Turnout | 551 | 50.4 | n/a | ||
Ministerial hold | Swing | N/A | |||
Electoral systems for the legislatures of the individual Australian states and territories are broadly similar to the electoral system used in federal elections in Australia.
The Victorian Legislative Council (VLC) is the upper house of the bicameral Parliament of Victoria, Australia, the lower house being the Legislative Assembly. Both houses sit at Parliament House in Spring Street, Melbourne. The Legislative Council serves as a house of review, in a similar fashion to its federal counterpart, the Australian Senate. Although, it is possible for legislation to be first introduced in the Council, most bills receive their first hearing in the Legislative Assembly.
The Western Australian Legislative Assembly, or lower house, is one of the two chambers of the Parliament of Western Australia, an Australian state. The Parliament sits in Parliament House in the Western Australian capital, Perth.
The Western Australian Legislative Council is the upper house of the Parliament of Western Australia, a state of Australia. It is regarded as a house of review for legislation passed by the Legislative Assembly, the lower house. The two Houses of Parliament sit in Parliament House in the state capital, Perth.
Foothills-Rocky View was a provincial electoral district in Alberta, Canada, mandated to return a single member to the Legislative Assembly of Alberta from under the First Past the Post voting system 2004 to 2012.
Airdrie-Rocky View was a provincial electoral district in Alberta, Canada, mandated to return a single member to the Legislative Assembly of Alberta using the first past the post method of voting from 1997 to 2004.
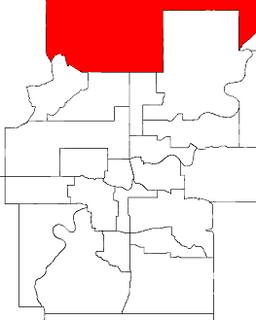
Athabasca-Redwater was a provincial electoral district in Alberta, Canada mandated to return a single member to the Legislative Assembly of Alberta using the first-past-the-post method of voting from 2004 to 2012.
Innisfail was a provincial electoral district in Alberta, Canada, mandated to return a single member to the Legislative Assembly of Alberta from 1905 to 1940 and again from 1971 to 1993.
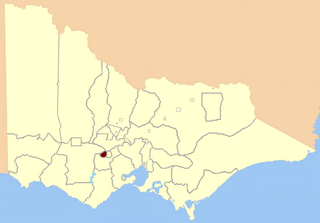
The Electoral district of Ballarat West was an electoral district of the Victorian Legislative Assembly in Australia. It existed from 1859–1927 and from 1992–2014.
A State Electoral District is an electorate within the Lower House or Legislative Assembly of Australian states and territories. Most state electoral districts send a single member to a state or territory's parliament using the preferential method of voting. The area of a state electoral district is dependent upon the Electoral Acts in the various states and vary in area between them. At present, there are 409 state electoral districts in Australia.
The electoral district of Lowan is a rural Victorian Legislative Assembly electoral district of the Victorian Parliament. It is located within the Western Victoria Region of the Legislative Council. It was initially created by the Electoral Act Amendment Act 1888, taking effect at the 1889 elections.
The Electoral district of Public Officers was an electoral district of the Victorian Legislative Assembly.
This is a list of members of the Western Australian Legislative Assembly between the 1905 elections and the 1908 elections, together known as the Sixth Parliament.
This is a list of members of the Western Australian Legislative Assembly between the 1904 elections and the 1905 elections, together known as the Fifth Parliament.
The 2008 Western Australian state election was held on Saturday 6 September 2008 to elect 59 members to the Legislative Assembly and 36 members to the Legislative Council. The incumbent centre-left Labor Party government, in power since the 2001 election and led since 25 January 2006 by Premier Alan Carpenter, was defeated by the centre-right Liberal Party opposition, led by Opposition Leader Colin Barnett since 6 August 2008.
High River was a provincial electoral district in Alberta mandated to return a single member to the Legislative Assembly of Alberta from 1905 to 1930.
William Dartnell Johnson was an Australian politician who was prominent in state politics in Western Australia for most of the first half of the 20th century. A member of the Labor Party, he served in the Legislative Assembly on three occasions – from 1901 to 1905, then again from 1906 to 1917, and finally from 1924 until his death. Johnson was elected leader of the Labor Party in October 1905, but three weeks later lost his own seat at the 1905 state election. He had previously been a minister in the government of Henry Daglish, and later returned to the ministry under John Scaddan. Towards the end of his career, Johnson also served just under a year as Speaker of the Legislative Assembly, from 1938 to 1939.
Richard Goldsmith Burges was an Australian pastoralist and politician who served in both houses of the Parliament of Western Australia. He was a member of the Legislative Council from 1894 to 1903, and then served in the Legislative Assembly from 1903 until his death.
This is a list of the results of the 1904 state election in Western Australia, listed by electoral district.
William Trezise Eddy was an Australian businessman and politician who was a member of the Legislative Assembly of Western Australia from 1905 to 1908, representing the seat of Coolgardie.