Results of the Queensland state election, 2017

Last updated

Queensland state election, 25 November 2017 [1] [2]
Legislative Assembly
<< 2015

Contents

Enrolled voters3,229,536
Votes cast2,826,613 Turnout 87.52−2.37
Informal votes122,672Informal4.34+2.23
Summary of votes by party
PartyPrimary votes%SwingSeatsChange
  Labor 957,89035.43–2.0548+4
  Liberal National 911,01933.69–7.6339−3
  One Nation 371,19313.73+12.811+1
  Greens 270,26310.00+1.571+1
  Katter's Australian 62,6132.32+0.393+1
  Consumer Rights 7,1670.27+0.270±0
  Independent 123,7964.58+0.951±0
Total2,703,941  93 

This is a list of electoral district results for the Queensland 2017 election.

This is a list of current and former electoral divisions for the Legislative Assembly of Queensland, the state legislature for Queensland, Australia.

Due to the redistribution of electoral boundaries for this election, swings are based on notional margins and percentages calculated by Antony Green of the Australian Broadcasting Corporation. [3]

Antony John Green is an Australian psephologist and commentator. He is the Australian Broadcasting Corporation's election analyst.

The Australian Broadcasting Corporation (ABC) is Australia's national broadcaster founded in 1929. It is currently principally funded by direct grants from the Australian government, but is expressly independent of government and partisan politics. The ABC plays a leading role in journalistic independence and is fundamental in the history of broadcasting in Australia.

Results by electoral district

Algester

Queensland state election, 2017: Algester [4]
PartyCandidateVotes%±
Labor Leeanne Enoch 14,42451.9+0.3
Liberal National Clinton Pattison6,02521.7−15.1
One Nation Darryl Lanyon5,05518.2+18.2
Greens Patsy O'Brien2,2778.2+1.2
Total formal votes27,78194.8−2.8
Informal votes1,5375.2+2.8
Turnout 29,31887.1−1.2
Two-party-preferred result
Labor Leeanne Enoch 17,89864.4+4.8
Liberal National Clinton Pattison9,88335.6−4.8
Labor hold Swing +4.8

Aspley

Queensland state election, 2017: Aspley [5]
PartyCandidateVotes%±
Liberal National Tracy Davis 12,75739.7−10.3
Labor Bart Mellish 12,04637.5−1.8
One Nation Shaun Byrne3,0819.6+9.6
Greens James Hansen3,0379.5−0.1
Independent Zachary King4941.5+1.5
Consumer Rights Neil Skilbeck4581.4+1.4
Independent Steve Ross2350.7+0.7
Total formal votes32,10896.2−2.1
Informal votes1,2783.8+2.1
Turnout 33,38690.5−0.7
Two-party-preferred result
Labor Bart Mellish 16,43051.2+4.3
Liberal National Tracy Davis 15,67848.8−4.3
Labor gain from Liberal National Swing +4.3

Bancroft

Queensland state election, 2017: Bancroft [6]
PartyCandidateVotes%±
Labor Chris Whiting 12,25243.0−7.2
Liberal National Kara Thomas7,63126.8−10.7
One Nation Chris Boulis5,43819.1+19.1
Greens Simone Dejun1,7726.2−0.1
Independent Barry Grant1,4255.0+5.0
Total formal votes28,51895.7−2.1
Informal votes1,2704.3+2.1
Turnout 29,78887.5+6.4
Two-party-preferred result
Labor Chris Whiting 16,02956.2−2.1
Liberal National Kara Thomas12,48943.8+2.1
Labor hold Swing −2.1

Barron River

Queensland state election, 2017: Barron River [7]
PartyCandidateVotes%±
Labor Craig Crawford 9,49733.5−6.0
Liberal National Michael Trout 8,68630.6−10.4
One Nation Andrew Schebella4,76016.8+16.8
Greens Cameron Boyd3,55112.5+2.2
Independent Cheryl Tonkin1,0393.7+3.7
Independent Andrew Hodgetts8262.9+2.9
Total formal votes28,35995.4−2.5
Informal votes1,3804.6+2.5
Turnout 29,73984.0−3.0
Two-party-preferred result
Labor Craig Crawford 14,70751.9−1.7
Liberal National Michael Trout 13,65248.1+1.7
Labor hold Swing −1.7

Bonney

Queensland state election, 2017: Bonney [8]
PartyCandidateVotes%±
Liberal National Sam O'Connor 11,40543.9−0.1
Labor Rowan Holzberger9,27935.7+0.7
Greens Amin Javanmard2,5409.8+1.0
Independent Robert Buegge1,6806.5+6.5
Independent Ron Nightingale1,0954.2+4.2
Total formal votes25,99994.1−3.1
Informal votes1,6335.9+3.1
Turnout 27,63283.2−1.8
Two-party-preferred result
Liberal National Sam O'Connor 13,02352.2−0.0
Labor Rowan Holzberger11,93747.8+0.0
Liberal National hold Swing −0.0

Broadwater

Queensland state election, 2017: Broadwater [9]
PartyCandidateVotes%±
Liberal National David Crisafulli 13,49948.5−8.5
Labor Peter Flori6,47723.3−1.5
One Nation Brenden Ball5,95921.4+18.6
Greens Daniel Kwon1,9086.9+1.1
Total formal votes27,84396.2−1.6
Informal votes1,1003.8+1.6
Turnout 28,94386.4+7.1
Two-party-preferred result
Liberal National David Crisafulli 18,92868.0+1.7
Labor Peter Flori8,91532.0−1.7
Liberal National hold Swing +1.7

Buderim

Queensland state election, 2017: Buderim [10]
PartyCandidateVotes%±
Liberal National Brent Mickelberg 10,91136.9−15.3
One Nation Steve Dickson 8,45228.6+28.6
Labor Ken MacKenzie6,63822.4−1.2
Greens Tracy Burton3,58712.1+1.2
Total formal votes29,58896.4−1.5
Informal votes1,0913.6+1.5
Turnout 30,67988.1+4.0
Two-party-preferred result
Liberal National Brent Mickelberg 18,16961.4−0.4
Labor Ken MacKenzie11,41938.6+0.4
Liberal National hold Swing −0.4

Bulimba

Queensland state election, 2017: Bulimba [11]
PartyCandidateVotes%±
Labor Di Farmer 15,67848.9+1.1
Liberal National Fiona Ward11,08034.5−7.3
Greens Felicity Jodell4,21113.1+2.7
Independent Bernadette Le Goullon6422.0+2.0
Independent Angus Jell4711.5+1.5
Total formal votes32,08296.6−2.0
Informal votes1,1403.4+2.0
Turnout 33,22287.8+1.8
Two-party-preferred result
Labor Di Farmer 19,49960.8+4.7
Liberal National Fiona Ward12,58339.2−4.7
Labor hold Swing +4.7

Bundaberg

Queensland state election, 2017: Bundaberg [12]
PartyCandidateVotes%±
Liberal National David Batt 10,57835.5−6.9
Labor Leanne Donaldson 10,23234.4−4.2
One Nation Jane Truscott6,68122.4+22.4
Greens Marianne Buchanan1,0503.5−0.6
Independent Alan Corbett 6812.3+2.3
Independent Richard Glass3131.1+1.1
Independent Richard Smith2480.8+0.8
Total formal votes29,78395.3−2.5
Informal votes1,4764.7+2.5
Turnout 31,25989.9−0.7
Two-party-preferred result
Liberal National David Batt 16,14254.2+4.7
Labor Leanne Donaldson 13,64145.8−4.7
Liberal National gain from Labor Swing +4.7

Bundamba

Queensland state election, 2017: Bundamba [13]
PartyCandidateVotes%±
Labor Jo-Ann Miller 13,88353.3−11.8
Liberal National Patrick Herbert3,94915.2−5.1
Greens Michelle Duncan2,84210.9+3.0
Independent Patricia Petersen 2,59910.0+10.0
Independent Shan-Ju Lin1,4135.4+5.4
Independent Trevor Judd1,3385.1+5.1
Total formal votes26,02491.8−5.9
Informal votes2,3378.2+5.9
Turnout 28,36184.3+3.3
Two-party-preferred result
Labor Jo-Ann Miller 18,62171.6−4.3
Liberal National Patrick Herbert7,40328.5+4.3
Labor hold Swing −4.3

Burdekin

Queensland state election, 2017: Burdekin [14]
PartyCandidateVotes%±
Labor Michael Brunker10,52436.0+4.6
Liberal National Dale Last 9,27431.7−3.0
One Nation Sam Cox 8,58729.3+26.0
Greens Mathew Bing8803.0+0.6
Total formal votes29,26596.7−1.6
Informal votes9973.3+1.6
Turnout 30,26288.2+1.1
Two-party-preferred result
Liberal National Dale Last 14,86650.8+2.2
Labor Michael Brunker14,39949.2−2.2
Liberal National gain from Labor Swing +2.2

Burleigh

Queensland state election, 2017: Burleigh [15]
PartyCandidateVotes%±
Liberal National Michael Hart 13,71749.7+3.9
Labor Gail Hislop9,43534.2+3.2
Greens Peter Burgoyne4,43416.1+5.2
Total formal votes27,58694.4−2.9
Informal votes1,6255.6+2.9
Turnout 29,21183.9−1.8
Two-party-preferred result
Liberal National Michael Hart 15,13254.9−0.6
Labor Gail Hislop12,45445.2+0.6
Liberal National hold Swing −0.6

Burnett

Queensland state election, 2017: Burnett [16]
PartyCandidateVotes%±
Liberal National Stephen Bennett 12,57042.4−4.1
One Nation Ashley Lynch7,90726.7+26.7
Labor Lee Harvey7,49125.3−4.4
Greens Tim Roberts1,6465.6+0.7
Total formal votes29,61496.1−1.5
Informal votes1,2053.9+1.5
Turnout 30,81990.6+1.4
Two-party-preferred result
Liberal National Stephen Bennett 17,96260.7+4.1
Labor Lee Harvey11,65239.4−4.1
Liberal National hold Swing +4.1

Cairns

Queensland state election, 2017: Cairns [17]
PartyCandidateVotes%±
Labor Michael Healy 8,64930.4−14.0
Liberal National Sam Marino7,87127.7−9.7
Independent Rob Pyne 5,44019.2+19.2
One Nation Ian Hodge4,15714.6+14.6
Greens Aaron McDonald2,2908.1+0.3
Total formal votes28,40795.9−1.7
Informal votes1,2064.1+1.7
Turnout 29,61381.0−0.4
Two-party-preferred result
Labor Michael Healy 15,16753.4−4.1
Liberal National Sam Marino13,24046.6+4.1
Labor hold Swing −4.1

Callide

Queensland state election, 2017: Callide [18]
PartyCandidateVotes%±
Liberal National Colin Boyce 9,66333.4−11.5
One Nation Sharon Lohse7,40825.6+25.6
Labor Darren Blackwood6,40422.2−1.4
Katter's Australian Robbie Radel3,76113.0+13.0
Greens Jaiben Baker9873.4+0.5
Independent Sandra Anderson6822.4+2.4
Total formal votes28,90596.4−1.8
Informal votes1,0893.6+1.8
Turnout 29,99489.4−1.8
Two-candidate-preferred result
Liberal National Colin Boyce 16,22056.1−3.7
One Nation Sharon Lohse12,68543.9+43.9
Liberal National hold Swing −3.7

Caloundra

Queensland state election, 2017: Caloundra [19]
PartyCandidateVotes%±
Liberal National Mark McArdle 11,06838.0−6.7
Labor Jason Hunt8,34828.7+0.1
One Nation Rod Jones6,57622.6+22.6
Greens Marcus Finch3,09810.6+0.9
Total formal votes29,09095.9−1.8
Informal votes1,2344.1+1.8
Turnout 30,32488.5+3.4
Two-party-preferred result
Liberal National Mark McArdle 15,53653.4−1.3
Labor Jason Hunt13,55446.6+1.3
Liberal National hold Swing −1.3

Capalaba

Queensland state election, 2017: Capalaba [20]
PartyCandidateVotes%±
Labor Don Brown 13,06543.0−4.4
Liberal National Cameron Leafe7,69625.3−14.8
One Nation Paul Taylor5,92219.5+19.5
Greens Joshua Sanderson2,5638.4−4.0
Independent Jason Lavender1,1663.8+3.8
Total formal votes30,41295.7−1.7
Informal votes1,3604.3+1.7
Turnout 31,77288.5−1.5
Two-party-preferred result
Labor Don Brown 17,94857.9+1.4
Liberal National Cameron Leafe13,07342.1−1.4
Labor hold Swing +1.4

Chatsworth

Queensland state election, 2017: Chatsworth [21]
PartyCandidateVotes%±
Liberal National Steve Minnikin 14,99349.8+0.2
Labor Paul Keene11,44238.0−0.8
Greens Dave Nelson3,65512.1+3.6
Total formal votes30,09095.9−2.4
Informal votes1,2804.1+2.4
Turnout 31,37090.1+1.4
Two-party-preferred result
Liberal National Steve Minnikin 15,91852.9−0.4
Labor Paul Keene14,17247.1+0.4
Liberal National hold Swing −0.4

Clayfield

Queensland state election, 2017: Clayfield [22]
PartyCandidateVotes%±
Liberal National Tim Nicholls 15,35947.8−4.8
Labor Philip Anthony10,55932.9+0.6
Greens Claire Ogden6,19019.3+7.3
Total formal votes32,10896.2−2.2
Informal votes1,2563.8+2.2
Turnout 33,36486.8+1.6
Two-party-preferred result
Liberal National Tim Nicholls 16,82952.4−4.2
Labor Philip Anthony15,27947.6+4.2
Liberal National hold Swing −4.2

Condamine

Queensland state election, 2017: Condamine [23]
PartyCandidateVotes%±
Liberal National Pat Weir 13,55441.8−10.4
One Nation Frank Ashman7,70923.8+23.8
Labor Brendon Huybregts5,84818.0−2.7
Katter's Australian John Hill3,69411.4−4.0
Greens Chris Turnbull1,6165.0+1.1
Total formal votes32,42196.7−1.4
Informal votes1,1173.3+1.4
Turnout 33,53891.8+3.7
Two-candidate-preferred result
Liberal National Pat Weir 17,74960.7−6.4
One Nation Frank Ashman11,48939.3+39.3
Liberal National hold Swing −6.4

Cook

Queensland state election, 2017: Cook [24]
PartyCandidateVotes%±
Labor Cynthia Lui 10,10540.1−0.3
One Nation Jen Sackley4,63918.4+18.4
Liberal National Penny Johnson4,47517.8−15.9
Katter's Australian Gordon Rasmussen4,27817.0+4.5
Greens Brynn Mathews1,7036.8+1.4
Total formal votes25,20095.7−2.3
Informal votes1,1244.3+2.3
Turnout 26,32481.3+0.1
Two-candidate-preferred result
Labor Cynthia Lui 14,07155.8−1.0
One Nation Jen Sackley11,12944.2+44.2
Labor hold Swing −1.0

Coomera

Queensland state election, 2017: Coomera [25]
PartyCandidateVotes%±
Liberal National Michael Crandon 11,53539.4−7.8
Labor Christopher Johnson9,15831.2−1.1
One Nation Ronald Pigdon5,99820.5+20.5
Greens Tayla Kerwin2,6208.9+3.3
Total formal votes29,31194.2−3.2
Informal votes1,8065.8+3.2
Turnout 31,11784.1+6.4
Two-party-preferred result
Liberal National Michael Crandon 15,67353.5−2.3
Labor Christopher Johnson13,63846.5+2.3
Liberal National hold Swing −2.3

Cooper

Queensland state election, 2017: Cooper [26]
PartyCandidateVotes%±
Labor Kate Jones 13,20540.8+1.7
Liberal National Robert Shearman11,51035.6−8.1
Greens Reece Walters6,66620.6+5.2
Independent Robert Wiltshire9603.0+3.0
Total formal votes32,34197.6−1.3
Informal votes8092.4+1.3
Turnout 33,15090.0−0.2
Two-party-preferred result
Labor Kate Jones 19,61460.6+7.3
Liberal National Robert Shearman12,72739.4−7.3
Labor hold Swing +7.3

Currumbin

Queensland state election, 2017: Currumbin [27]
PartyCandidateVotes%±
Liberal National Jann Stuckey 13,21547.7+1.8
Labor Georgi Leader9,87435.6+5.9
Greens David Wyatt3,24911.7+0.4
Independent Andrew Semple1,3755.0+5.0
Total formal votes27,71395.3−2.3
Informal votes1,3524.7+2.3
Turnout 29,06584.5+1.6
Two-party-preferred result
Liberal National Jann Stuckey 14,77553.3−2.4
Labor Georgi Leader12,93846.7+2.4
Liberal National hold Swing −2.4

Everton

Queensland state election, 2017: Everton [28]
PartyCandidateVotes%±
Liberal National Tim Mander 16,75651.8+2.2
Labor David Greene11,61635.9−4.2
Greens Bridget Clinch3,99712.3+2.4
Total formal votes32,36996.2−2.1
Informal votes1,2733.8+2.1
Turnout 33,64291.3+0.8
Two-party-preferred result
Liberal National Tim Mander 17,78454.9+2.9
Labor David Greene14,58545.1−2.9
Liberal National hold Swing +2.9

Ferny Grove

Queensland state election, 2017: Ferny Grove [29]
PartyCandidateVotes%±
Labor Mark Furner 12,59040.5−3.0
Liberal National Nick Elston12,44640.1−0.9
Greens Elizabeth World4,82015.5+4.3
Independent Lisa Foo1,2083.9+3.9
Total formal votes31,06496.9−1.7
Informal votes9783.1+1.7
Turnout 32,04290.4−1.0
Two-party-preferred result
Labor Mark Furner 16,97154.6−0.7
Liberal National Nick Elston14,09345.4+0.7
Labor hold Swing −0.7

Gaven

Queensland state election, 2017: Gaven [30]
PartyCandidateVotes%±
Liberal National Sid Cramp 12,21046.1+6.4
Labor Meaghan Scanlon 11,40643.1+14.5
Greens Sally Spain2,86610.8+4.7
Total formal votes26,48293.5−3.4
Informal votes1,8486.5+3.4
Turnout 28,33086.4−2.2
Two-party-preferred result
Labor Meaghan Scanlon 13,43050.7+3.5
Liberal National Sid Cramp 13,05249.3−3.5
Labor gain from Liberal National Swing +3.5

Gladstone

Queensland state election, 2017: Gladstone [31]
PartyCandidateVotes%±
Labor Glenn Butcher 17,30764.3+11.1
One Nation Amy Lohse5,49720.4+20.4
Liberal National Chay Conaglen3,11311.6−3.8
Greens Peta Baker9983.7−0.3
Total formal votes26,91596.7−1.6
Informal votes9293.3+1.6
Turnout 27,84486.4−3.8
Two-candidate-preferred result
Labor Glenn Butcher 19,02870.7+7.7
One Nation Amy Lohse7,88729.3+29.3
Labor hold Swing +7.7

Glass House

Queensland state election, 2017: Glass House [32]
PartyCandidateVotes%±
Liberal National Andrew Powell 10,22135.5−8.1
Labor Brent Hampstead7,55726.3−5.2
One Nation Tracey Bell-Henselin6,52522.7+22.7
Greens Sue Weber3,70512.9−1.3
Independent Sue Mureau7652.7+2.7
Total formal votes28,77396.4−1.5
Informal votes1,0683.6+1.5
Turnout 29,84189.4+0.1
Two-party-preferred result
Liberal National Andrew Powell 15,37353.4+2.5
Labor Brent Hampstead13,40046.6−2.5
Liberal National hold Swing +2.5

Greenslopes

Queensland state election, 2017: Greenslopes [33]
PartyCandidateVotes%±
Labor Joe Kelly 12,93042.3+0.0
Liberal National Ian Kaye 11,11036.4−5.0
Greens Victor Huml6,49821.3+7.6
Total formal votes30,53896.5−1.9
Informal votes1,1143.5+1.9
Turnout 31,65288.5+1.7
Two-party-preferred result
Labor Joe Kelly 18,36460.1+5.1
Liberal National Ian Kaye 12,17439.9−5.1
Labor hold Swing +5.1

Gregory

Queensland state election, 2017: Gregory [34]
PartyCandidateVotes%±
Liberal National Lachlan Millar 9,55645.3−0.8
One Nation Mark Higgins5,11324.2+24.1
Labor Dave Kerrigan4,42220.9−5.3
Independent Bruce Currie1,3766.5+1.1
Greens Norman Weston6453.1+1.1
Total formal votes21,11296.8−1.5
Informal votes7033.2+1.5
Turnout 21,81587.7−7.0
Two-candidate-preferred result
Liberal National Lachlan Millar 13,49963.9+3.0
One Nation Mark Higgins7,61336.1+36.1
Liberal National hold Swing +3.0

Gympie

Queensland state election, 2017: Gympie [35]
PartyCandidateVotes%±
Liberal National Tony Perrett 11,82937.2−4.5
One Nation Chelle Dobson9,44429.7+29.0
Labor Tracey McWilliam7,10922.4−0.4
Greens Roxanne Kennedy-Perriman1,8095.7−0.1
Independent Donna Reardon1,5745.0+5.0
Total formal votes31,76595.8−2.1
Informal votes1,3924.2+2.1
Turnout 33,15789.7+2.5
Two-candidate-preferred result
Liberal National Tony Perrett 18,64058.7+0.5
One Nation Chelle Dobson13,12541.3+41.3
Liberal National hold Swing +0.5

Hervey Bay

Queensland state election, 2017: Hervey Bay [36]
PartyCandidateVotes%±
Liberal National Ted Sorensen 12,04937.7−10.1
Labor Adrian Tantari9,28229.1−2.6
One Nation Damian Huxham8,05925.2+25.2
Greens Jenni Cameron1,6195.1+1.4
Independent Jannean Dean9372.9−0.9
Total formal votes31,94696.0−1.7
Informal votes1,3454.0+1.7
Turnout 33,29188.5+2.8
Two-party-preferred result
Liberal National Ted Sorensen 18,88059.1+2.6
Labor Adrian Tantari13,06640.9−2.6
Liberal National hold Swing +2.6

Hill

Queensland state election, 2017: Hill [37]
PartyCandidateVotes%±
Katter's Australian Shane Knuth 15,06548.2+20.8
Liberal National Mario Quagliata7,13622.8−14.6
Labor Diana O'Brien5,92318.9−6.1
Greens Johanna Kloot2,0526.6+1.6
Independent Stewart Worth8572.7+2.7
Independent Chester Tuxford2430.8+0.8
Total formal votes31,27696.4−1.8
Informal votes1,1533.6+1.8
Turnout 32,42987.9−2.3
Two-candidate-preferred result
Katter's Australian Shane Knuth 21,81569.7+14.9
Liberal National Mario Quagliata9,46130.3−14.9
Katter's Australian hold Swing +14.9

Hinchinbrook

Queensland state election, 2017: Hinchinbrook [38]
PartyCandidateVotes%±
Liberal National Andrew Cripps 8,52330.1−7.6
One Nation Margaret Bell6,23222.0+16.2
Katter's Australian Nick Dametto 5,92920.9+8.1
Labor Paul Jacob5,38419.0−8.4
Independent Peter Raffles1,3164.7+4.7
Greens Lyle Burness9173.2+0.1
Total formal votes28,30195.9−2.2
Informal votes1,2084.1+2.2
Turnout 29,50988.1+3.5
Two-candidate-preferred result
Katter's Australian Nick Dametto 16,28857.6+57.6
Liberal National Andrew Cripps 12,01342.5−11.0
Katter's Australian gain from Liberal National Swing +11.0

Inala

Queensland state election, 2017: Inala [39]
PartyCandidateVotes%±
Labor Annastacia Palaszczuk 18,55868.0+3.7
Liberal National Leanne McFarlane5,65120.7−7.0
Greens Nav Singh Sidhu3,09711.3+3.9
Total formal votes27,30692.8−5.1
Informal votes2,1057.2+5.1
Turnout 29,41186.6+0.8
Two-party-preferred result
Labor Annastacia Palaszczuk 20,77876.1+5.5
Liberal National Leanne McFarlane6,52823.9−5.5
Labor hold Swing +5.5

Ipswich

Queensland state election, 2017: Ipswich [40]
PartyCandidateVotes%±
Labor Jennifer Howard 12,81548.0−4.5
One Nation Malcolm Roberts 7,10626.6+25.8
Liberal National Andrew Caswell3,71213.9−14.4
Greens Brett Morrissey2,3198.7+0.9
Independent Troy Aggett7572.8+2.8
Total formal votes26,70994.8−3.2
Informal votes1,4735.2+3.2
Turnout 28,18288.7+0.9
Two-candidate-preferred result
Labor Jennifer Howard 16,26260.9−5.1
One Nation Malcolm Roberts 10,44739.1+39.1
Labor hold Swing −5.1

Ipswich West

Queensland state election, 2017: Ipswich West [41]
PartyCandidateVotes%±
Labor Jim Madden 13,56047.3−0.1
One Nation Brad Trussell8,07828.2+19.8
Liberal National Anna O'Neill4,74616.5−18.1
Greens Keith Muller2,3038.0+2.0
Total formal votes28,68795.3−2.7
Informal votes1,4274.7+2.7
Turnout 30,11488.8+2.9
Two-candidate-preferred result
Labor Jim Madden 16,84458.7−0.4
One Nation Brad Trussell11,84341.3+41.3
Labor hold Swing −0.4

Jordan

Queensland state election, 2017: Jordan [42]
PartyCandidateVotes%±
Labor Charis Mullen 11,02639.6−12.8
One Nation Michael Pucci 5,25518.9+15.8
Liberal National Duncan Murray4,01214.4−17.3
Independent Phil Cutcliffe2,6829.6+9.6
Independent Steve Hodgson2,2938.2+8.2
Greens Steven Purcell2,0687.4−0.6
Consumer Rights Peter Ervik4891.8+1.8
Total formal votes27,82593.7−4.0
Informal votes1,8586.3+4.0
Turnout 29,68389.0+2.4
Two-candidate-preferred result
Labor Charis Mullen 16,66959.9−3.6
One Nation Michael Pucci 11,15640.1+40.1
Labor hold Swing −3.6

Kawana

Queensland state election, 2017: Kawana [43]
PartyCandidateVotes%±
Liberal National Jarrod Bleijie 16,26855.9+5.3
Labor Mark Moss7,41525.5−1.1
Greens Annette Spendlove3,05810.5+1.6
Independent Michael Jessop1,4725.1+2.3
Independent Jeremy Davey8873.0+3.0
Total formal votes29,10095.1−2.5
Informal votes1,4994.9+2.5
Turnout 30,59987.8+1.6
Two-party-preferred result
Liberal National Jarrod Bleijie 18,35463.1+2.9
Labor Mark Moss10,74636.9−2.9
Liberal National hold Swing +2.9

Keppel

Queensland state election, 2017: Keppel [44]
PartyCandidateVotes%±
Labor Brittany Lauga 13,30443.1−0.8
One Nation Matt Loth7,86525.5+25.5
Liberal National Peter Blundell7,69124.9−15.0
Greens Clancy Mullbrick2,0396.6+1.8
Total formal votes30,89996.6−1.7
Informal votes1,0983.4+1.7
Turnout 31,99790.6+2.5
Two-candidate-preferred result
Labor Brittany Lauga 16,41953.1−1.0
One Nation Matt Loth14,48046.9+46.9
Labor hold Swing −1.0

Kurwongbah

Queensland state election, 2017: Kurwongbah [45]
PartyCandidateVotes%±
Labor Shane King 12,25541.4−6.0
Liberal National Allan Cook7,24724.5−14.4
One Nation Karen Haddock6,45221.8+21.8
Greens Rachel Doherty2,5198.5+0.6
Independent Thor Prohaska1,1343.8+3.8
Total formal votes29,60795.6−2.1
Informal votes1,3744.4+2.1
Turnout 30,98189.1−0.1
Two-party-preferred result
Labor Shane King 16,87457.0−0.1
Liberal National Allan Cook12,73343.0+0.1
Labor hold Swing −0.1

Lockyer

Queensland state election, 2017: Lockyer [46]
PartyCandidateVotes%±
Liberal National Jim McDonald 10,37735.8+0.8
One Nation Jim Savage9,96034.4+8.5
Labor Nicole Lincoln6,63522.9−2.6
Greens Ian Simons1,3174.5+0.9
Independent Tony Parr6832.4+2.4
Total formal votes28,97296.1−2.3
Informal votes1,1763.9+2.3
Turnout 30,14889.8+1.6
Two-candidate-preferred result
Liberal National Jim McDonald 15,66654.1+2.5
One Nation Jim Savage13,30645.9+45.9
Liberal National hold Swing +2.5

Logan

Queensland state election, 2017: Logan [47]
PartyCandidateVotes%±
Labor Linus Power 11,48842.3−2.8
One Nation Scott Bannan8,38730.9+29.1
Liberal National Gloria Vicario4,96818.3−19.3
Greens Liam Jenkinson1,3274.9−2.0
Independent Danielle Cox6162.3+2.3
Independent Daniel Murphy3601.3+1.3
Total formal votes27,14694.3−2.7
Informal votes1,6385.7+2.7
Turnout 28,78487.2−2.7
Two-candidate-preferred result
Labor Linus Power 15,42656.8+0.9
One Nation Scott Bannan11,72043.2+43.2
Labor hold Swing +0.9

Lytton

Queensland state election, 2017: Lytton [48]
PartyCandidateVotes%±
Labor Joan Pease 15,41648.9−0.3
Liberal National Karren Strahan7,66324.3−11.9
One Nation Suzanne Black4,85415.4+15.4
Greens Ken Austin3,57311.3+2.4
Total formal votes31,50696.8−1.4
Informal votes1,0573.2+1.4
Turnout 32,56389.9+1.0
Two-party-preferred result
Labor Joan Pease 19,54162.0+2.1
Liberal National Karren Strahan11,96538.0−2.1
Labor hold Swing +2.1

Macalister

Queensland state election, 2017: Macalister [49]
PartyCandidateVotes%±
Labor Melissa McMahon 10,21036.7−8.1
Liberal National Judi van Manen7,42126.6−10.9
Independent Hetty Johnston 6,44823.2+23.2
Greens Gabi Nehring1,8516.6−1.0
Consumer Rights Ben Musgrave9173.3+3.3
Independent Greg Bradley5221.9+1.9
Independent Janelle Clancy4801.7+1.7
Total formal votes27,84993.4−3.8
Informal votes1,9736.6+3.8
Turnout 29,82285.5+0.7
Two-party-preferred result
Labor Melissa McMahon 15,99957.4+1.0
Liberal National Judi van Manen11,85042.6−1.0
Labor hold Swing +1.0

Mackay

Queensland state election, 2017: Mackay [50]
PartyCandidateVotes%±
Labor Julieanne Gilbert 13,28142.9−0.2
Liberal National Nicole Batzloff7,65724.7−4.0
One Nation Jeff Keioskie7,00922.6+22.6
Greens Elliot Jennings1,5425.0+0.2
Independent Martin McCann1,4594.7+4.7
Total formal votes30,94895.5−2.1
Informal votes1,4454.5+2.1
Turnout 32,39386.9−2.6
Two-party-preferred result
Labor Julieanne Gilbert 18,05458.3−1.9
Liberal National Nicole Batzloff12,89441.7+1.9
Labor hold Swing −1.9

Maiwar

Queensland state election, 2017: Maiwar [51]
PartyCandidateVotes%±
Liberal National Scott Emerson 13,35241.9−5.8
Greens Michael Berkman 8,85027.8+7.4
Labor Ali King8,77227.5−1.5
Independent Anita Diamond8882.8+2.8
Total formal votes31,86297.6−1.1
Informal votes7852.4+1.1
Turnout 32,64786.8+1.1
Two-candidate-preferred result
Greens Michael Berkman 16,44951.6+51.6
Liberal National Scott Emerson 15,41348.4−4.6
Greens gain from Liberal National Swing +4.6

Mansfield

Queensland state election, 2017: Mansfield [52]
PartyCandidateVotes%±
Liberal National Ian Walker 11,61040.2−5.3
Labor Corrine McMillan 11,37539.4−2.3
Greens Barbara Bell3,26311.3+1.8
One Nation Neil Symes 2,6319.1+9.1
Total formal votes28,87995.9−2.4
Informal votes1,2434.1+2.4
Turnout 30,12289.0−2.2
Two-party-preferred result
Labor Corrine McMillan 14,90851.6+0.8
Liberal National Ian Walker 13,97148.4−0.8
Labor hold Swing +0.8

Maroochydore

Queensland state election, 2017: Maroochydore [53]
PartyCandidateVotes%±
Liberal National Fiona Simpson 12,66144.7−4.8
Labor Julie McGlone7,15725.2+1.2
One Nation Cam Young4,59216.2+16.2
Greens Daniel Bryar3,93613.9+1.4
Total formal votes28,34696.3−1.6
Informal votes1,1013.7+1.6
Turnout 29,44785.7+2.0
Two-party-preferred result
Liberal National Fiona Simpson 16,58758.5−1.8
Labor Julie McGlone11,75941.5+1.8
Liberal National hold Swing −1.8

Maryborough

Queensland state election, 2017: Maryborough [54]
PartyCandidateVotes%±
Labor Bruce Saunders 14,20845.2+19.4
One Nation James Hansen9,54630.4+23.7
Liberal National Richard Kingston5,67118.0−13.7
Greens Craig Armstrong1,1023.5+1.1
Independent Roger Currie9192.9+2.9
Total formal votes31,44696.2−1.8
Informal votes1,2373.8+1.8
Turnout 32,68390.5+2.5
Two-candidate-preferred result
Labor Bruce Saunders 16,49752.5+1.4
One Nation James Hansen14,94947.5+47.5
Labor hold Swing +1.4

McConnel

Queensland state election, 2017: McConnel [55]
PartyCandidateVotes%±
Liberal National Jamie Forster10,01736.5−5.5
Labor Grace Grace 9,23833.7−2.5
Greens Kirsten Lovejoy7,43627.1+7.8
Independent John Dobinson2831.0+1.0
Independent Edward Gilmour2420.9+0.9
Independent Kamala Emanuel2170.8+0.8
Total formal votes27,43396.1−2.3
Informal votes1,1283.9+2.3
Turnout 28,56181.6+3.8
Two-party-preferred result
Labor Grace Grace 15,87457.9+4.8
Liberal National Jamie Forster11,55942.1−4.8
Labor hold Swing +4.8

Mermaid Beach

Queensland state election, 2017: Mermaid Beach [56]
PartyCandidateVotes%±
Liberal National Ray Stevens 12,23245.5−4.4
Labor Joshua Blundell-Thornton6,64624.7−2.7
Independent Mona Hecke3,16211.8+11.8
Greens Helen Wainwright2,5999.7+0.0
Independent Saraya Beric1,2864.8+4.8
Independent Ric Allport5412.0+2.0
Independent Gary Pead3911.5+1.5
Total formal votes26,85793.4−3.8
Informal votes1,9106.6+3.8
Turnout 28,76783.4+2.1
Two-party-preferred result
Liberal National Ray Stevens 15,11056.3−4.0
Labor Joshua Blundell-Thornton11,74743.7+4.0
Liberal National hold Swing −4.0

Miller

Queensland state election, 2017: Miller [57]
PartyCandidateVotes%±
Labor Mark Bailey 11,40338.0+0.9
Liberal National Belinda Kippen10,96936.6−2.7
Greens Deniz Clarke6,56721.9+4.9
Independent Ted Starr1,0333.4+3.4
Total formal votes29,97297.3−1.2
Informal votes8162.7+1.2
Turnout 30,78889.1−2.3
Two-party-preferred result
Labor Mark Bailey 17,43958.2+2.6
Liberal National Belinda Kippen12,53341.8−2.6
Labor hold Swing +2.6

Mirani

Queensland state election, 2017: Mirani [58]
PartyCandidateVotes%±
Labor Jim Pearce 10,59236.7−4.3
One Nation Stephen Andrew 9,23432.0+32.0
Liberal National Kerry Latter7,75326.9−11.4
Greens Christine Carlisle1,2474.3+0.2
Total formal votes28,82696.5−1.4
Informal votes1,0333.5+1.4
Turnout 29,85991.1−0.7
Two-candidate-preferred result
One Nation Stephen Andrew 15,80154.8+54.8
Labor Jim Pearce 13,02545.2−8.6
One Nation gain from Labor Swing +8.6

Moggill

Queensland state election, 2017: Moggill [59]
PartyCandidateVotes%±
Liberal National Christian Rowan 15,08548.7−1.4
Labor Evan Jones8,21226.5+1.2
Greens Lawson McCane6,47920.9+4.9
Consumer Rights Amy Rayward1,2153.9+3.9
Total formal votes30,99197.3−1.2
Informal votes8732.7+1.2
Turnout 31,86491.3+0.6
Two-party-preferred result
Liberal National Christian Rowan 17,05555.0−3.1
Labor Evan Jones13,93645.0+3.1
Liberal National hold Swing −3.1

Morayfield

Queensland state election, 2017: Morayfield [60]
PartyCandidateVotes%±
Labor Mark Ryan 13,10145.8−4.9
One Nation Rodney Hansen7,22325.2+25.2
Liberal National Jason Snow5,74420.1−10.8
Greens Gavin Behrens1,7276.0+0.4
Independent Jamie Janulewicz8372.9+2.9
Total formal votes28,63295.5−1.9
Informal votes1,3354.5+1.9
Turnout 29,96786.6+4.1
Two-candidate-preferred result
Labor Mark Ryan 16,81458.7−4.8
One Nation Rodney Hansen11,81841.3+41.3
Labor hold Swing −4.8

Mount Ommaney

Queensland state election, 2017: Mount Ommaney [61]
PartyCandidateVotes%±
Labor Jess Pugh 13,21542.7+2.6
Liberal National Tarnya Smith 11,27036.4−8.7
Greens Jenny Mulkearns4,21113.6+2.5
One Nation Ian Eugarde2,2507.3+7.3
Total formal votes30,94696.6−1.5
Informal votes1,0883.4+1.5
Turnout 32,03490.7−0.9
Two-party-preferred result
Labor Jess Pugh 17,25555.8+4.8
Liberal National Tarnya Smith 13,69144.2−4.8
Labor hold Swing +4.8

Mudgeeraba

Queensland state election, 2017: Mudgeeraba [62]
PartyCandidateVotes%±
Liberal National Ros Bates 13,69546.1−3.9
Labor Paul Taylor6,97723.5−4.5
One Nation Andrew Liddell5,28817.8+17.8
Greens Rod Duncan2,7639.3+1.4
Independent Bill Sherwood6252.1+0.3
Independent Jill Pead3851.3+1.3
Total formal votes29,73394.9−2.4
Informal votes1,6055.1+2.4
Turnout 31,33886.4+2.3
Two-party-preferred result
Liberal National Ros Bates 17,79559.8−0.6
Labor Paul Taylor11,93840.2+0.6
Liberal National hold Swing −0.6

Mulgrave

Queensland state election, 2017: Mulgrave [63]
PartyCandidateVotes%±
Labor Curtis Pitt 13,25648.1−2.8
Liberal National Karina Samperi6,28722.8−8.6
One Nation Sue Bertuch6,15822.3+22.3
Greens Carmel Murray1,8576.7+2.7
Total formal votes27,55895.1−2.6
Informal votes1,4164.9+2.6
Turnout 28,97484.7−0.6
Two-party-preferred result
Labor Curtis Pitt 16,78960.9−2.0
Liberal National Karina Samperi10,76939.1+2.0
Labor hold Swing −2.0

Mundingburra

Queensland state election, 2017: Mundingburra [64]
PartyCandidateVotes%±
Labor Coralee O'Rourke 8,76831.4−6.0
Liberal National Matthew Derlagen7,29026.1−14.5
One Nation Mal Charlwood4,65216.7+15.5
Katter's Australian Mike Abraham3,87413.9+10.8
Greens Jenny Brown2,1307.6+0.7
Independent Dennis Easzon4681.7+1.7
Independent Alan Birrell3651.3+1.3
Independent Geoff Virgo3601.3+1.3
Total formal votes27,90795.1−2.6
Informal votes1,4234.9+2.6
Turnout 29,33086.8−3.9
Two-party-preferred result
Labor Coralee O'Rourke 14,26851.1−0.7
Liberal National Matthew Derlagen13,63948.9+0.7
Labor hold Swing −0.7

Murrumba

Queensland state election, 2017: Murrumba [65]
PartyCandidateVotes%±
Labor Steven Miles 14,11145.7−3.3
Liberal National Reg Gulley 7,95325.7−14.8
One Nation Scott Dare6,00219.4+19.4
Greens Jason Kennedy2,8419.2+0.5
Total formal votes30,90795.6−2.0
Informal votes1,4374.4+2.0
Turnout 32,34487.3+2.4
Two-party-preferred result
Labor Steven Miles 18,39659.5+3.2
Liberal National Reg Gulley 12,51140.5−3.2
Labor hold Swing +3.2

Nanango

Queensland state election, 2017: Nanango [66]
PartyCandidateVotes%±
Liberal National Deb Frecklington 15,05348.0+1.6
One Nation Douglas Grant8,60627.4+27.4
Labor Ben Rankin6,04419.3−0.8
Greens John Harbison1,6585.3+1.6
Total formal votes31,36196.6−1.6
Informal votes1,0913.4+1.6
Turnout 32,45289.6−1.3
Two-candidate-preferred result
Liberal National Deb Frecklington 19,87163.4+0.1
One Nation Douglas Grant11,49036.6+36.6
Liberal National hold Swing +0.1

Nicklin

Queensland state election, 2017: Nicklin [67]
PartyCandidateVotes%±
Liberal National Marty Hunt 8,73231.7−1.4
Labor Justin Raethel6,93125.2+8.3
One Nation Steven Ford5,79021.0+21.0
Greens Mick Tyrrell3,41312.4+2.8
Consumer Rights Jeffrey Hodges1,0033.6+3.6
Independent Tony R. Moore9723.5+3.5
Independent Rachel Radic7052.6+2.6
Total formal votes27,54695.6−2.3
Informal votes1,2784.4+2.3
Turnout 28,82487.8+0.3
Two-party-preferred result
Liberal National Marty Hunt 15,22755.3+1.6
Labor Justin Raethel12,31944.7−1.6
Liberal National gain from Independent Swing +1.6

Ninderry

Queensland state election, 2017: Ninderry [68]
PartyCandidateVotes%±
Liberal National Dan Purdie 10,70336.1−7.3
Labor Bill Gissane6,74422.8+1.0
One Nation Barry Ward5,52918.7+18.7
Greens Sue Etheridge4,23714.3+0.6
Independent Richard Bruinsma1,4795.0+5.0
Independent Jamila Riley9443.2+3.2
Total formal votes29,63695.0−2.8
Informal votes1,5465.0+2.8
Turnout 31,18287.3+3.3
Two-party-preferred result
Liberal National Dan Purdie 17,30158.4+1.5
Labor Bill Gissane12,33541.6−1.5
Liberal National hold Swing +1.5

Noosa

Queensland state election, 2017: Noosa [69]
PartyCandidateVotes%±
Independent Sandy Bolton 9,47931.4+31.4
Liberal National Glen Elmes 8,89229.4−16.5
Labor Mark Denham3,86912.8−8.5
One Nation Eve-Marie Whiteside3,55111.8+11.8
Greens Phillip Jenkins3,49211.6−10.2
Independent Aaron White6102.0+2.0
Independent Robin Bristow3011.0+1.0
Total formal votes30,19496.3−1.5
Informal votes1,1713.7+1.5
Turnout 31,36587.7+0.8
Two-candidate-preferred result
Independent Sandy Bolton 18,57861.5+61.5
Liberal National Glen Elmes 11,61638.5−18.1
Independent gain from Liberal National Swing +18.1

Nudgee

Queensland state election, 2017: Nudgee [70]
PartyCandidateVotes%±
Labor Leanne Linard 16,07451.9+4.0
Liberal National Debbie Glaze8,89628.7−7.1
Greens Ell-Leigh Ackerman4,13013.3+3.4
Independent Anthony Simpson1,8996.1+6.1
Total formal votes30,99996.0−2.3
Informal votes1,2774.0+2.3
Turnout 32,27688.2+1.3
Two-party-preferred result
Labor Leanne Linard 19,94064.3+5.1
Liberal National Debbie Glaze11,05935.7−5.1
Labor hold Swing +5.1

Oodgeroo

Queensland state election, 2017: Oodgeroo [71]
PartyCandidateVotes%±
Liberal National Mark Robinson 14,54952.4+0.1
Labor Tony Austin9,38933.8−1.8
Greens Brad Scott3,81213.7+1.7
Total formal votes27,75095.6−2.6
Informal votes1,2824.4+2.6
Turnout 29,03290.4+0.5
Two-party-preferred result
Liberal National Mark Robinson 15,88357.2+1.5
Labor Tony Austin11,86742.8−1.5
Liberal National hold Swing +1.5

Pine Rivers

Queensland state election, 2017: Pine Rivers [72]
PartyCandidateVotes%±
Labor Nikki Boyd 12,00236.9−6.6
Liberal National Chris Thompson8,72726.9−15.1
One Nation Peter Warren3,95612.2+12.2
Greens Jack Margaritis2,8498.8−1.1
Independent Seath Holswich 2,5457.8+7.8
Independent Michael Kosenko2,0556.3+6.3
Consumer Rights Greg French3551.1+1.1
Total formal votes32,48996.1−1.8
Informal votes1,3143.9+1.8
Turnout 33,80391.3+1.6
Two-party-preferred result
Labor Nikki Boyd 18,25556.2+2.1
Liberal National Chris Thompson14,23443.8−2.1
Labor hold Swing +2.1

Pumicestone

Queensland state election, 2017: Pumicestone [73]
PartyCandidateVotes%±
Labor Michael Hoogwaerts10,50635.6−3.6
Liberal National Simone Wilson 8,82529.9−14.6
One Nation Greg Fahey6,89423.3+23.3
Greens Tony Longland1,4645.0−0.6
Independent Rick Williams 1,3474.6+4.6
Independent Jason Burgess4991.7+1.7
Total formal votes29,53595.8−2.0
Informal votes1,2874.2+2.0
Turnout 30,82288.1+2.6
Two-party-preferred result
Liberal National Simone Wilson 15,01550.8+0.7
Labor Michael Hoogwaerts14,52049.2−0.7
Liberal National hold Swing +0.7

Redcliffe

Queensland state election, 2017: Redcliffe [74]
PartyCandidateVotes%±
Labor Yvette D'Ath 13,85145.2−2.0
Liberal National Kerri-Anne Dooley11,41437.2−0.5
Greens James Bovill2,4468.0+2.4
Independent Ian Philp1,0873.5+3.5
Independent Graham Young1,0783.5+3.5
Independent Shayne Jarvis7702.5+0.2
Total formal votes30,64695.3−2.7
Informal votes1,4984.7+2.7
Turnout 32,14487.6−0.6
Two-party-preferred result
Labor Yvette D'Ath 16,81154.9−2.7
Liberal National Kerri-Anne Dooley13,83545.1+2.7
Labor hold Swing −2.7

Redlands

Queensland state election, 2017: Redlands [75]
PartyCandidateVotes%±
Labor Kim Richards 9,59132.3−3.3
Liberal National Matt McEachan 9,43531.8−11.5
One Nation Jason Quick5,26217.7+17.7
Independent Peter Dowling 2,8899.7+9.7
Greens David Keogh2,5278.5+0.8
Total formal votes29,70496.0−1.7
Informal votes1,2434.0+1.7
Turnout 30,94789.4+3.0
Two-party-preferred result
Labor Kim Richards 15,76053.1+4.3
Liberal National Matt McEachan 13,94446.9−4.3
Labor gain from Liberal National Swing +4.3

Rockhampton

Queensland state election, 2017: Rockhampton [76]
PartyCandidateVotes%±
Labor Barry O'Rourke 9,67531.7−21.2
Independent Margaret Strelow7,17423.5+23.5
One Nation Wade Rothery6,52121.4+21.4
Liberal National Douglas Rodgers5,44217.9−12.4
Greens Kate Giamarelos1,6745.5−0.7
Total formal votes30,48695.7−1.6
Informal votes1,3624.3+1.6
Turnout 31,84889.0−1.3
Two-candidate-preferred result
Labor Barry O'Rourke 16,82555.2−8.8
One Nation Wade Rothery13,66144.8+44.8
Labor hold Swing −8.8

Sandgate

Queensland state election, 2017: Sandgate [77]
PartyCandidateVotes%±
Labor Stirling Hinchliffe 15,46049.1−0.6
Liberal National Jessie Van Der Hoek7,30823.2−13.5
One Nation Matthew Stephen4,70315.0+15.0
Greens Miree Le Roy3,98512.7+2.4
Total formal votes31,45696.5−1.6
Informal votes1,1503.5+1.6
Turnout 32,60690.3+1.3
Two-party-preferred result
Labor Stirling Hinchliffe 19,96963.5+3.4
Liberal National Jessie Van Der Hoek11,48736.5−3.4
Labor hold Swing +3.4

Scenic Rim

Queensland state election, 2017: Scenic Rim [78]
PartyCandidateVotes%±
Liberal National Jon Krause 12,87841.0−7.5
One Nation Rod Smith8,66227.6+19.0
Labor Carolyn Buchan6,74821.5−5.7
Greens Shannon Girard3,1099.9+1.7
Total formal votes31,39796.1−1.8
Informal votes1,2673.9+1.8
Turnout 32,66490.1+7.0
Two-candidate-preferred result
Liberal National Jon Krause 19,81963.1+3.8
One Nation Rod Smith11,57836.9+36.9
Liberal National hold Swing +3.8

South Brisbane

Queensland state election, 2017: South Brisbane [79]
PartyCandidateVotes%±
Labor Jackie Trad 10,00736.0−6.0
Greens Amy MacMahon9,54934.4+11.7
Liberal National Simon Quinn6,76424.3−8.0
Independent Cameron Murray5161.9+1.9
Independent Karel Boele4841.7−1.2
Independent Karagh-Mae Kelly2490.9+0.9
Independent Frank Jordan2300.8+0.8
Total formal votes27,79996.4−2.0
Informal votes1,0523.6+2.0
Turnout 28,85183.7+3.1
Two-candidate-preferred result
Labor Jackie Trad 14,88753.6−10.2
Greens Amy MacMahon12,91246.5+46.5
Labor hold Swing −10.2

Southern Downs

Queensland state election, 2017: Southern Downs [80]
PartyCandidateVotes%±
Liberal National James Lister 12,79741.2−21.6
One Nation Joshua Coyne6,33120.4+20.4
Labor Joel Richters5,24516.9−6.6
Independent Rob Mackenzie5,04216.2+16.2
Greens Antonia van Geuns1,3404.3−2.9
Independent Jay Nauss3001.0+1.0
Total formal votes31,05596.3−1.7
Informal votes1,1813.7+1.7
Turnout 32,23690.5+0.1
Two-candidate-preferred result
Liberal National James Lister 19,58463.1−6.1
One Nation Joshua Coyne11,47136.9+36.9
Liberal National hold Swing −6.1

Southport

Queensland state election, 2017: Southport [81]
PartyCandidateVotes%±
Liberal National Rob Molhoek 12,49947.1−2.5
Labor Judy Searle7,87729.7−1.9
Greens Michelle Le Plastrier2,80610.6+2.4
Independent Rick Flori2,5979.8+9.8
Consumer Rights Johan Joubert7692.9+2.9
Total formal votes26,54894.8−2.6
Informal votes1,4585.2+2.6
Turnout 28,00682.4+1.1
Two-party-preferred result
Liberal National Rob Molhoek 15,19757.2−0.6
Labor Judy Searle11,35142.8+0.6
Liberal National hold Swing −0.6

Springwood

Queensland state election, 2017: Springwood [82]
PartyCandidateVotes%±
Labor Mick de Brenni 13,28944.2+3.8
Liberal National Julie Talty12,11740.3−2.1
Greens Neil Cotter2,7219.0+0.4
Consumer Rights John Taylor1,9616.5+6.5
Total formal votes30,08895.3−2.8
Informal votes1,4904.7+2.8
Turnout 31,57889.4+0.7
Two-party-preferred result
Labor Mick de Brenni 16,12553.6+2.2
Liberal National Julie Talty13,96346.4−2.2
Labor hold Swing +2.2

Stafford

Queensland state election, 2017: Stafford [83]
PartyCandidateVotes%±
Labor Anthony Lynham 15,35748.1+0.4
Liberal National Ed Sangjitphun10,73933.6−3.9
Greens John Meyer5,83518.3+4.7
Total formal votes31,93196.1−2.2
Informal votes1,2963.9+2.2
Turnout 33,22788.3−1.6
Two-party-preferred result
Labor Anthony Lynham 19,83062.1+2.8
Liberal National Ed Sangjitphun12,10137.9−2.8
Labor hold Swing +2.8

Stretton

Queensland state election, 2017: Stretton [84]
PartyCandidateVotes%±
Labor Duncan Pegg 14,06150.6+8.1
Liberal National Freya Ostapovitch 7,88428.4−9.9
One Nation Shane Holley3,29811.9+11.9
Greens Anisa Nandaula2,0597.4+1.0
Independent Shyamal Reddy4841.7+1.7
Total formal votes27,78695.0−2.9
Informal votes1,4545.0+2.9
Turnout 29,24087.2−0.7
Two-party-preferred result
Labor Duncan Pegg 16,64059.9+4.6
Liberal National Freya Ostapovitch 11,14640.1−4.6
Labor hold Swing +4.6

Surfers Paradise

Queensland state election, 2017: Surfers Paradise [85]
PartyCandidateVotes%±
Liberal National John-Paul Langbroek 16,12763.2+1.2
Labor Tony Walker5,71522.4+1.3
Greens Scott Turner2,3239.1+1.5
Independent Chris Manley7853.1+3.1
Independent Tylere Baker-Pearce5562.2+2.2
Total formal votes25,50694.5−3.3
Informal votes1,4975.5+3.3
Turnout 27,00381.0−0.5
Two-party-preferred result
Liberal National John-Paul Langbroek 17,79969.8−0.6
Labor Tony Walker7,70730.2+0.6
Liberal National hold Swing −0.6

Theodore

Queensland state election, 2017: Theodore [86]
PartyCandidateVotes%±
Liberal National Mark Boothman 10,67839.7−5.4
Labor Luz Stanton8,46231.5+0.3
One Nation Darrell Lane5,11419.0+19.0
Greens Tina Meni2,6349.8+3.8
Total formal votes26,88894.6−2.4
Informal votes1,5255.4+2.4
Turnout 28,41385.5+5.1
Two-party-preferred result
Liberal National Mark Boothman 14,44553.7−1.6
Labor Luz Stanton12,44346.3+1.6
Liberal National hold Swing −1.6

Thuringowa

Queensland state election, 2017: Thuringowa [87]
PartyCandidateVotes%±
Labor Aaron Harper 9,39432.2−8.9
Liberal National Nick Martinez6,19121.2−13.0
One Nation Mark Thornton5,87820.2+14.3
Katter's Australian Terry Fox4,54615.6+15.6
Greens Mike Rubenach1,6335.6+1.3
Independent Stephen Lane1,5275.2+5.2
Total formal votes29,16994.9−2.5
Informal votes1,5725.1+2.5
Turnout 30,74186.8−1.0
Two-candidate-preferred result
Labor Aaron Harper 15,79554.1−2.4
One Nation Mark Thornton13,37445.9+45.9
Labor hold Swing −2.4

Toohey

Queensland state election, 2017: Toohey [88]
PartyCandidateVotes%±
Labor Peter Russo 12,28444.6−1.3
Liberal National Anthony Shorten 8,33630.3−7.1
Greens Gordon King4,02614.6+2.9
One Nation Guansheng (Victor) Zhang2,89110.5+10.5
Total formal votes27,53795.2−2.7
Informal votes1,3984.8+2.7
Turnout 28,93586.1−1.6
Two-party-preferred result
Labor Peter Russo 16,52660.0+1.7
Liberal National Anthony Shorten 11,01140.0−1.7
Labor hold Swing +1.7

Toowoomba North

Queensland state election, 2017: Toowoomba North [89]
PartyCandidateVotes%±
Liberal National Trevor Watts 13,12842.2−2.2
Labor Kerry Shine 10,27433.0−5.8
One Nation Paul Wilson4,56114.7+14.7
Greens Emmeline Chidley2,0336.5+2.0
Independent Josie Townsend1,1183.6+3.6
Total formal votes31,11496.4−1.7
Informal votes1,1663.6+1.7
Turnout 32,28088.2−1.9
Two-party-preferred result
Liberal National Trevor Watts 17,33755.7+4.1
Labor Kerry Shine 13,77744.3−4.1
Liberal National hold Swing +4.1

Toowoomba South

Queensland state election, 2017: Toowoomba South [90]
PartyCandidateVotes%±
Liberal National David Janetzki 14,89346.5−8.1
Labor Susan Krause8,62626.9−7.9
One Nation Jeremy Scamp5,27316.5+16.5
Greens Alyce Nelligan2,3087.2−2.5
Independent Rob Berry9232.9+2.9
Total formal votes32,02396.3−1.3
Informal votes1,2433.7+1.3
Turnout 33,26688.9−1.8
Two-party-preferred result
Liberal National David Janetzki 19,20860.0+1.6
Labor Susan Krause12,81540.0−1.6
Liberal National hold Swing +1.6

Townsville

Queensland state election, 2017: Townsville [91]
PartyCandidateVotes%±
Labor Scott Stewart 9,45733.6−6.5
Liberal National Casie Scott8,70930.9−5.1
One Nation Allan Evans5,61119.9+16.1
Greens Rebecca Ryan3,05710.9+2.5
Independent Lindy Collins1,3304.7+4.7
Total formal votes28,16496.1−1.8
Informal votes1,1533.9+1.8
Turnout 29,31783.9−1.8
Two-party-preferred result
Labor Scott Stewart 14,18950.4−5.3
Liberal National Casie Scott13,97549.6+5.3
Labor hold Swing −5.3

Traeger

Queensland state election, 2017: Traeger [92]
PartyCandidateVotes%±
Katter's Australian Robbie Katter 13,63866.2+17.9
Labor Danielle Slade3,41616.6−1.7
Liberal National Ron Bird2,07110.1−18.5
Independent Sarah Isaacs6833.3+3.3
Greens Peter Relph4432.2+0.2
Independent Craig Scriven3421.7+1.7
Total formal votes20,59396.0−2.3
Informal votes8474.0+2.3
Turnout 21,44082.0−1.2
Two-candidate-preferred result
Katter's Australian Robbie Katter 16,16378.5+12.4
Labor Danielle Slade4,43021.5+21.5
Katter's Australian hold Swing +12.4

Warrego

Queensland state election, 2017: Warrego [93]
PartyCandidateVotes%±
Liberal National Ann Leahy 11,94947.6−5.0
Labor Mark O'Brien5,44121.7−4.7
Katter's Australian Rob Loughnan5,32921.2+16.5
Independent Mark Stone8633.4+3.4
Greens Ian Mazlin7753.1+0.3
Independent Sandra Bamberry7322.9+2.9
Total formal votes25,08995.8−2.1
Informal votes1,1004.2+2.1
Turnout 26,18988.4−2.8
Two-candidate-preferred result
Liberal National Ann Leahy 14,91759.5−5.0
Katter's Australian Rob Loughnan10,17240.5+40.5
Liberal National hold Swing −5.0

Waterford

Queensland state election, 2017: Waterford [94]
PartyCandidateVotes%±
Labor Shannon Fentiman 12,50147.7−4.5
One Nation Kim Miller5,42320.7+20.7
Liberal National Felicity Westguard5,24820.0−11.6
Greens Kirsty Petersen1,9187.3−0.8
Independent Lee McKenzie McKinnon1,1134.2+4.2
Total formal votes26,20394.0−3.0
Informal votes1,6816.0+3.0
Turnout 27,88484.4+3.4
Two-candidate-preferred result
Labor Shannon Fentiman 15,91860.7−2.4
One Nation Kim Miller10,28539.3+39.3
Labor hold Swing −2.4

Whitsunday

Queensland state election, 2017: Whitsunday [95]
PartyCandidateVotes%±
Liberal National Jason Costigan 8,77432.2−9.5
Labor Bronwyn Taha8,50331.2−4.7
One Nation Noel Skippen5,47120.1+20.1
Katter's Australian Jenny Whitney2,4999.2+9.2
Greens Imogen Lindenberg1,5625.7−0.9
Independent Dan Van Blarcom4771.7+1.7
Total formal votes27,28696.0−1.9
Informal votes1,1474.0+1.9
Turnout 28,43386.3−0.1
Two-party-preferred result
Liberal National Jason Costigan 13,82950.7+0.1
Labor Bronwyn Taha13,45749.3−0.1
Liberal National hold Swing +0.1

Woodridge

Queensland state election, 2017: Woodridge [96]
PartyCandidateVotes%±
Labor Cameron Dick 17,83765.1+1.6
Liberal National Michael Rooms4,12215.0−5.0
Independent Trevor Palmer3,38512.3+3.6
Greens Jacob Rice2,0727.6+0.7
Total formal votes27,41692.1−4.5
Informal votes2,3407.9+4.5
Turnout 29,75682.0−2.1
Two-party-preferred result
Labor Cameron Dick 20,93776.4+0.6
Liberal National Michael Rooms6,47923.6−0.6
Labor hold Swing +0.6

Related Research Articles

Electoral district of Barron River state electoral district of Queensland, Australia

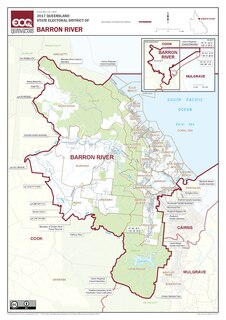
Barron River is an electoral district of the Legislative Assembly in the Australian state of Queensland.

Electoral district of Toowoomba South state electoral district of Queensland, Australia

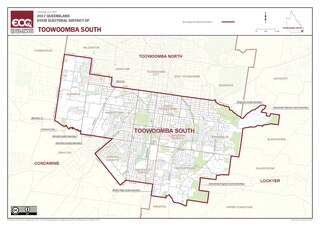
Toowoomba South is an electoral district of the Legislative Assembly in the Australian state of Queensland. It was created with the 1972 redistribution, and replaced the abolished Toowoomba East.

Electoral district of Lockyer state electoral district of Queensland, Australia

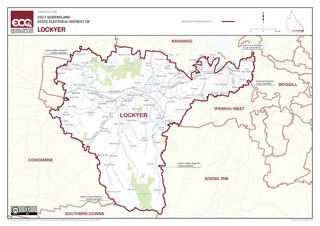
Lockyer is an electoral district of the Legislative Assembly in the Australian state of Queensland.

Electoral district of Ipswich state electoral district of Queensland, Australia

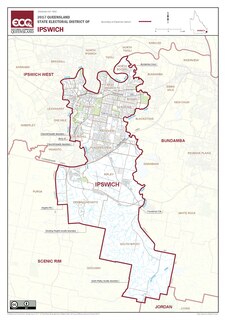
Ipswich is a Legislative Assembly of Queensland electoral district on the Brisbane River, west of Brisbane in the Australian state of Queensland. The electorate includes Ipswich and its suburbs, south and east of the Bremer River, west of Bundamba Creek and north of the Cunningham Highway.

Electoral district of Kurwongbah state electoral district of Queensland, Australia

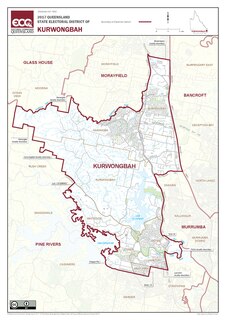
Kurwongbah is an electoral district of the Legislative Assembly in the Australian state of Queensland from 1992 to 2009, and was re-introduced for the 2017 state election. It is named after Lake Kurwongbah.The district is based in the Moreton Bay Region.

This is a list of electoral results for the electoral district of Buderim in Queensland state elections.

This is a list of electoral results for the electoral district of Ipswich in Queensland state elections.

This is a list of electoral results for the electoral district of Ipswich West in Queensland state elections.

This is a list of electoral results for the electoral district of Mansfield in Queensland state elections.

This is a list of electoral results for the electoral district of Pine Rivers in Queensland state elections.

This is a list of electoral results for the electoral district of South Brisbane in Queensland state elections.

This is a list of electoral results for the electoral district of Toowoomba North in Queensland state elections.

This is a list of electoral results for the electoral district of Toowoomba South in Queensland state elections.

This is a list of electoral results for the electoral district of Townsville in Queensland state elections.

Electoral district of Scenic Rim state electoral district of Queensland, Australia

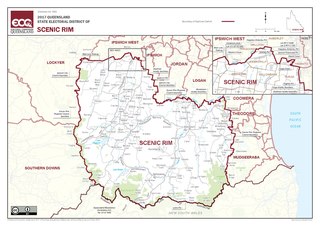
Scenic Rim is an electoral district of the Legislative Assembly in the Australian state of Queensland. It was created in the 2017 redistribution, and was won at the 2017 election by Jon Krause.

Electoral district of Oodgeroo state electoral district of Queensland, Australia

Oodgeroo is an electoral district of the Legislative Assembly in the Australian state of Queensland. It was created in the 2017 redistribution, and was won at that year's election by Mark Robinson. It was named after Indigenous activist and poet Oodgeroo Noonuccal.

Electoral district of Jordan state electoral district of Queensland, Australia

Jordan is an electoral district of the Legislative Assembly in the Australian state of Queensland. It was created in the 2017 redistribution. It was named after politician Vi Jordan, second female Member of the Queensland Legislative Assembly.

Electoral district of Maiwar state electoral district of Queensland, Australia

Maiwar is an electoral district of the Legislative Assembly in the Australian state of Queensland, incorporating the inner western suburbs of Brisbane. It was created in the 2017 redistribution, and was first contested at the 2017 Queensland state election. It is named for the Indigenous name of the Brisbane River, which is the southern boundary of the electorate.

Electoral district of Ninderry state electoral district of Queensland, Australia

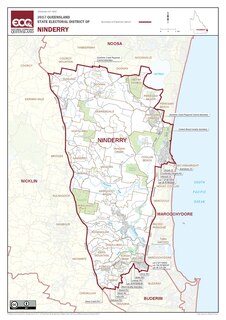
Ninderry is an electoral district of the Legislative Assembly in the Australian state of Queensland. It was created in the 2017 redistribution.

Electoral district of Hill state electoral district of Queensland, Australia

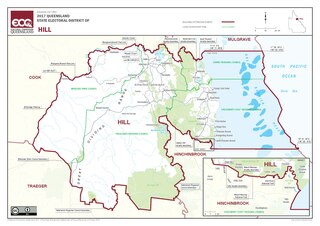
Hill is an electoral district of the Legislative Assembly in the Australian state of Queensland. It was created in the 2017 redistribution, and first contested at the Queensland state election the same year. It was named after geologist Dorothy Hill.

References

  1. "2017 State General Election Results". Electoral Commission of Queensland. Retrieved 9 December 2017.
  2. "Qld Election 2017". ABC Elections. Retrieved 9 December 2017.
  3. Green, Antony. "2017 Queensland State Redistribution". ABC. Retrieved 11 December 2017.
  4. 2017 State General Election - Algester - District Summary, ECQ.
  5. 2017 State General Election - Aspley - District Summary, ECQ.
  6. 2017 State General Election - Bancroft - District Summary, ECQ.
  7. 2017 State General Election - Barron River - District Summary, ECQ.
  8. 2017 State General Election - Bonney - District Summary, ECQ.
  9. 2017 State General Election - Broadwater - District Summary, ECQ.
  10. 2017 State General Election - Buderim - District Summary, ECQ.
  11. 2017 State General Election - Bulimba - District Summary, ECQ.
  12. 2017 State General Election - Bundaberg - District Summary, ECQ.
  13. 2017 State General Election - Bundamba - District Summary, ECQ.
  14. 2017 State General Election - Burdekin - District Summary, ECQ.
  15. 2017 State General Election - Burleigh - District Summary, ECQ.
  16. 2017 State General Election - Burnett - District Summary, ECQ.
  17. 2017 State General Election - Cairns - District Summary, ECQ.
  18. 2017 State General Election - Callide - District Summary, ECQ.
  19. 2017 State General Election - Caloundra - District Summary, ECQ.
  20. 2017 State General Election - Capalaba - District Summary, ECQ.
  21. 2017 State General Election - Chatsworth - District Summary, ECQ.
  22. 2017 State General Election - Clayfield - District Summary, ECQ.
  23. 2017 State General Election - Condamine - District Summary, ECQ.
  24. 2017 State General Election - Cook - District Summary, ECQ.
  25. 2017 State General Election - Coomera - District Summary, ECQ.
  26. 2017 State General Election - Cooper - District Summary, ECQ.
  27. 2017 State General Election - Currumbin - District Summary, ECQ.
  28. 2017 State General Election - Everton - District Summary, ECQ.
  29. 2017 State General Election - Ferny Grove - District Summary, ECQ.
  30. 2017 State General Election - Gaven - District Summary, ECQ.
  31. 2017 State General Election - Gladstone - District Summary, ECQ.
  32. 2017 State General Election - Glass House - District Summary, ECQ.
  33. 2017 State General Election - Greenslopes - District Summary, ECQ.
  34. 2017 State General Election - Gregory - District Summary, ECQ.
  35. 2017 State General Election - Gympie - District Summary, ECQ.
  36. 2017 State General Election - Hervey Bay - District Summary, ECQ.
  37. 2017 State General Election - Hill - District Summary, ECQ.
  38. 2017 State General Election - Hinchinbrook - District Summary, ECQ.
  39. 2017 State General Election - Inala - District Summary, ECQ.
  40. 2017 State General Election - Ipswich - District Summary, ECQ.
  41. 2017 State General Election - Ipswich West - District Summary, ECQ.
  42. 2017 State General Election - Jordan - District Summary, ECQ.
  43. 2017 State General Election - Kawana - District Summary, ECQ.
  44. 2017 State General Election - Keppel - District Summary, ECQ.
  45. 2017 State General Election - Kurwongbah - District Summary, ECQ.
  46. 2017 State General Election - Lockyer - District Summary, ECQ.
  47. 2017 State General Election - Logan - District Summary, ECQ.
  48. 2017 State General Election - Lytton - District Summary, ECQ.
  49. 2017 State General Election - Macalister - District Summary, ECQ.
  50. 2017 State General Election - Mackay - District Summary, ECQ.
  51. 2017 State General Election - Maiwar - District Summary, ECQ.
  52. 2017 State General Election - Mansfield - District Summary, ECQ.
  53. 2017 State General Election - Maroochydore - District Summary, ECQ.
  54. 2017 State General Election - Maryborough - District Summary, ECQ.
  55. 2017 State General Election - McConnel - District Summary, ECQ.
  56. 2017 State General Election - Mermaid Beach - District Summary, ECQ.
  57. 2017 State General Election - Miller - District Summary, ECQ.
  58. 2017 State General Election - Mirani - District Summary, ECQ.
  59. 2017 State General Election - Moggill - District Summary, ECQ.
  60. 2017 State General Election - Morayfield - District Summary, ECQ.
  61. 2017 State General Election - Mount Ommaney - District Summary, ECQ.
  62. 2017 State General Election - Mudgeeraba - District Summary, ECQ.
  63. 2017 State General Election - Mulgrave - District Summary, ECQ.
  64. 2017 State General Election - Mundingburra - District Summary, ECQ.
  65. 2017 State General Election - Murrumba - District Summary, ECQ.
  66. 2017 State General Election - Nanango - District Summary, ECQ.
  67. 2017 State General Election - Nicklin - District Summary, ECQ.
  68. 2017 State General Election - Ninderry - District Summary, ECQ.
  69. 2017 State General Election - Noosa - District Summary, ECQ.
  70. 2017 State General Election - Nudgee - District Summary, ECQ.
  71. 2017 State General Election - Oodgeroo - District Summary, ECQ.
  72. 2017 State General Election - Pine Rivers - District Summary, ECQ.
  73. 2017 State General Election - Pumicestone - District Summary, ECQ.
  74. 2017 State General Election - Redcliffe - District Summary, ECQ.
  75. 2017 State General Election - Redlands - District Summary, ECQ.
  76. 2017 State General Election - Rockhampton - District Summary, ECQ.
  77. 2017 State General Election - Sandgate - District Summary, ECQ.
  78. 2017 State General Election - Scenic Rim - District Summary, ECQ.
  79. 2017 State General Election - South Brisbane - District Summary, ECQ.
  80. 2017 State General Election - Southern Downs - District Summary, ECQ.
  81. 2017 State General Election - Southport - District Summary, ECQ.
  82. 2017 State General Election - Springwood - District Summary, ECQ.
  83. 2017 State General Election - Stafford - District Summary, ECQ.
  84. 2017 State General Election - Stretton - District Summary, ECQ.
  85. 2017 State General Election - Surfers Paradise - District Summary, ECQ.
  86. 2017 State General Election - Theodore - District Summary, ECQ.
  87. 2017 State General Election - Thuringowa - District Summary, ECQ.
  88. 2017 State General Election - Toohey - District Summary, ECQ.
  89. 2017 State General Election - Toowoomba North - District Summary, ECQ.
  90. 2017 State General Election - Toowoomba South - District Summary, ECQ.
  91. 2017 State General Election - Townsville - District Summary, ECQ.
  92. 2017 State General Election - Traeger - District Summary, ECQ.
  93. 2017 State General Election - Warrego - District Summary, ECQ.
  94. 2017 State General Election - Waterford - District Summary, ECQ.
  95. 2017 State General Election - Whitsunday - District Summary, ECQ.
  96. 2017 State General Election - Woodridge - District Summary, ECQ.