Safety stock

Last updated

Safety stock is a term used by logisticians to describe a level of extra stock that is maintained to mitigate risk of stockouts (shortfall in raw material or packaging) caused by uncertainties in supply and demand. Adequate safety stock levels permit business operations to proceed according to their plans. [1] Safety stock is held when uncertainty exists in demand, supply, or manufacturing yield, and serves as an insurance against stockouts.

Contents

Safety stock is an additional quantity of an item held in the inventory to reduce the risk that the item will be out of stock. It acts as a buffer stock in case sales are greater than planned and/or the supplier is unable to deliver the additional units at the expected time.

With a new product, safety stock can be used as a strategic tool until the company can judge how accurate its forecast is after the first few years, especially when it is used with a material requirements planning (MRP) worksheet. The less accurate the forecast, the more safety stock is required to ensure a given level of service. With an MRP worksheet, a company can judge how much it must produce to meet its forecasted sales demand without relying on safety stock. However, a common strategy is to try to reduce the level of safety stock to help keep inventory costs low once the product demand becomes more predictable. That can be extremely important for companies with a smaller financial cushion or those trying to run on lean manufacturing, which is aimed towards eliminating waste throughout the production process.

The amount of safety stock that an organization chooses to keep on hand can dramatically affect its business. Too much safety stock can result in high holding costs of inventory. In addition, products that are stored for too long a time can spoil, expire, or break during the warehousing process. Too little safety stock can result in lost sales and, in the thus a higher rate of customer turnover. As a result, finding the right balance between too much and too little safety stock is essential.

Reasons for keeping safety stock

Safety stocks are mainly used in a "make-to-stock" manufacturing strategy, which is employed when the lead time of manufacturing is too long to satisfy the customer demand at the right cost/quality/waiting time.

The main goal of safety stocks is to absorb the variability of customer demand. Indeed, production planning is based on a forecast, which is (by definition) different from the real demand. By absorbing these variations, safety stock improves the customer-service level.

Creating a safety stock will also delay stockouts from other variations, like an upward trend in customer demand, allowing time to adjust capacity.

Safety stock is used as a buffer to protect organizations from stockouts caused by inaccurate planning or poor schedule adherence by suppliers. As such, its cost (in both material and management) is often seen as a drain on financial resources that results in reduction initiatives. In addition, time-sensitive goods such as food, drink, and other perishable items could spoil and go to waste if held as safety stock for too long. [1] Various methods exist to reduce safety stock; these include better use of technology, increased collaboration with suppliers, and more accurate forecasting. [2] [3] In a lean supply environment, lead times are reduced, which can help minimize safety stock levels, thus reducing the likelihood and impact of stockouts. [4] Due to the cost of safety stock, many organizations opt for a service level-led safety stock calculation; for example, a 95% service level could result in stockouts, but is at a level that is acceptable to the company. The lower the service level, the lower the requirement for safety stock.

An enterprise resource planning system (ERP system) can also help an organization reduce its level of safety stock. Most ERP systems provide a type of production planning module. An ERP module such as this can help a company develop highly accurate and dynamic sales forecasts and sales and operations plans. By creating more accurate and dynamic forecasts, a company reduces its chance of producing insufficient inventory for a given period, thus should be able to reduce the amount of safety stock required. [1] In addition, ERP systems use established formulas to help calculate appropriate levels of safety stock based on the previously developed production plans. While an ERP system aids an organization in estimating a reasonable amount of safety stock, the ERP module must be set up to plan requirements effectively. [5]

Inventory policy

The size of the safety stock depends on the type of inventory policy in effect. An inventory node is supplied from a "source" which fulfills orders for the considered product after a certain replenishment lead time. In a periodic inventory policy, the inventory level is checked periodically (such as once a month) and an order is placed at that time as to meet the expected demand until the next order. In this case, the safety stock is calculated considering the demand and supply variability risks during this period plus the replenishment lead time. If the inventory policy is continuous policy (such as an order point-order quantity policy or an order point-order up to policy) the inventory level is continuously monitored and orders are placed with freedom of time. In this case, safety stock is calculated considering the risk of only the replenishment lead time. If applied correctly, continuous inventory policies can lead to smaller safety stock whilst ensuring higher service levels, in line with lean processes and more efficient overall business management. However, continuous inventory policies are much harder to implement, so most of the organisations using traditional planning processes and tools opt for periodic inventory policy.

Methods for calculating safety stocks

Reorder point method with demand and lead time uncertainty for type I service

A commonly used approach calculates [6] [7] the safety stock based on the following factors:

Assuming that demand during successive unit time periods are independent and identically distributed random variables drawn from a normal distribution, the safety stock can be calculated as: [9]

where,

The reorder point can then be calculated as:

The first term in the ROP formula is the average demand during the lead time. The second term is the safety stock. If the lead time is deterministic, i.e. , then the ROP formula is simplified as .

Issues with this approach

No universal formula exists for safety stock, and application of the one above can cause serious damage. [12] [13] It makes several implicit assumptions:

  • The assumption that demand is a succession of independent normal random variables: First, real demand cannot be negative. If the ratio of standard deviation to mean is quite high, this will skew the distribution (compared to the normal distribution), leading to consistent overestimation of safety stock by this formula. Second, and more importantly, demand is often influenced by external random factors which persist for more than one time period, so that the successive demands are not independent. With a very large number of sources (for example, consumers of a central retail warehouse), that may not be an issue[ clarification needed ], but otherwise it is (for example, for a manufacturer that supplies these retail warehouses)
  • The use of average and standard demand assumes it is constant. For seasonal demand (for example high in summer, low in winter), the formula will consistently produce stock outs in summer and waste in winter. Similar errors apply for demand that grows or declines. That does not invalidate the formula, but it influences the parameters to be input into the formula in each time period.
  • Lead time is extremely hard to quantify in complex manufacturing and/or purchase environment, which has become the norm in global supply chains that span many independent partners. In practice, lead time is estimated by a rule of thumb that hardly improves on estimating safety stock with a rule of thumb. Even when lead time is correctly quantified, the formula assumes supply (production and purchase) is statistically constant, which is not always the case.

Type II service

Another popular approach described by Nahmias [14] uses the standardized unit loss integral L(z), given by:

Where is cumulative distribution function for the standard normal. Let β be the proportion of demands met from stock (service level), Q the order quantity and σ the standard deviation of demand, then the following relationship holds:

In this case, the safety stock is given by:

and the expected number of units out of stock during an order cycle is given by σL(z). [15]

See also

Related Research Articles

<span class="mw-page-title-main">Normal distribution</span> Probability distribution

In statistics, a normal distribution or Gaussian distribution is a type of continuous probability distribution for a real-valued random variable. The general form of its probability density function is

<span class="mw-page-title-main">Pauli matrices</span> Matrices important in quantum mechanics and the study of spin

In mathematical physics and mathematics, the Pauli matrices are a set of three 2 × 2 complex matrices that are Hermitian, involutory and unitary. Usually indicated by the Greek letter sigma, they are occasionally denoted by tau when used in connection with isospin symmetries.

<span class="mw-page-title-main">Standard deviation</span> In statistics, a measure of variation

In statistics, the standard deviation is a measure of the amount of variation of a random variable expected about its mean. A low standard deviation indicates that the values tend to be close to the mean of the set, while a high standard deviation indicates that the values are spread out over a wider range.

In the mathematical field of differential geometry, the Riemann curvature tensor or Riemann–Christoffel tensor is the most common way used to express the curvature of Riemannian manifolds. It assigns a tensor to each point of a Riemannian manifold. It is a local invariant of Riemannian metrics which measures the failure of the second covariant derivatives to commute. A Riemannian manifold has zero curvature if and only if it is flat, i.e. locally isometric to the Euclidean space. The curvature tensor can also be defined for any pseudo-Riemannian manifold, or indeed any manifold equipped with an affine connection.

<span class="mw-page-title-main">Radon transform</span> Integral transform

In mathematics, the Radon transform is the integral transform which takes a function f defined on the plane to a function Rf defined on the (two-dimensional) space of lines in the plane, whose value at a particular line is equal to the line integral of the function over that line. The transform was introduced in 1917 by Johann Radon, who also provided a formula for the inverse transform. Radon further included formulas for the transform in three dimensions, in which the integral is taken over planes. It was later generalized to higher-dimensional Euclidean spaces and more broadly in the context of integral geometry. The complex analogue of the Radon transform is known as the Penrose transform. The Radon transform is widely applicable to tomography, the creation of an image from the projection data associated with cross-sectional scans of an object.

In statistical inference, specifically predictive inference, a prediction interval is an estimate of an interval in which a future observation will fall, with a certain probability, given what has already been observed. Prediction intervals are often used in regression analysis.

In econometrics, the autoregressive conditional heteroskedasticity (ARCH) model is a statistical model for time series data that describes the variance of the current error term or innovation as a function of the actual sizes of the previous time periods' error terms; often the variance is related to the squares of the previous innovations. The ARCH model is appropriate when the error variance in a time series follows an autoregressive (AR) model; if an autoregressive moving average (ARMA) model is assumed for the error variance, the model is a generalized autoregressive conditional heteroskedasticity (GARCH) model.

Service level measures the performance of a system. Certain goals are defined and the service level gives the percentage to which those goals should be achieved. Fill rate is different from service level.

Capacity planning is the process of determining the production capacity needed by an organization to meet changing demands for its products. In the context of capacity planning, design capacity is the maximum amount of work that an organization or individual is capable of completing in a given period. Effective capacity is the maximum amount of work that an organization or individual is capable of completing in a given period due to constraints such as quality problems, delays, material handling, etc.

<span class="mw-page-title-main">Covariant formulation of classical electromagnetism</span> Ways of writing certain laws of physics

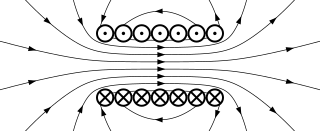
The covariant formulation of classical electromagnetism refers to ways of writing the laws of classical electromagnetism in a form that is manifestly invariant under Lorentz transformations, in the formalism of special relativity using rectilinear inertial coordinate systems. These expressions both make it simple to prove that the laws of classical electromagnetism take the same form in any inertial coordinate system, and also provide a way to translate the fields and forces from one frame to another. However, this is not as general as Maxwell's equations in curved spacetime or non-rectilinear coordinate systems.

In mathematical finance, the SABR model is a stochastic volatility model, which attempts to capture the volatility smile in derivatives markets. The name stands for "stochastic alpha, beta, rho", referring to the parameters of the model. The SABR model is widely used by practitioners in the financial industry, especially in the interest rate derivative markets. It was developed by Patrick S. Hagan, Deep Kumar, Andrew Lesniewski, and Diana Woodward.

<span class="mw-page-title-main">Truncated normal distribution</span> Type of probability distribution

In probability and statistics, the truncated normal distribution is the probability distribution derived from that of a normally distributed random variable by bounding the random variable from either below or above. The truncated normal distribution has wide applications in statistics and econometrics.

The reorder point (ROP) is the level of inventory which triggers an action to replenish that particular inventory. It is a minimum amount of an item which a firm holds in stock, such that, when stock falls to this amount, the item must be reordered. It is normally calculated as the forecast usage during the replenishment lead time plus safety stock. In the EOQ model, it was assumed that there is no time lag between ordering and procuring of materials.

In set theory, a mathematical discipline, the Jensen hierarchy or J-hierarchy is a modification of Gödel's constructible hierarchy, L, that circumvents certain technical difficulties that exist in the constructible hierarchy. The J-Hierarchy figures prominently in fine structure theory, a field pioneered by Ronald Jensen, for whom the Jensen hierarchy is named. Rudimentary functions describe a method for iterating through the Jensen hierarchy.

Demand forecasting refers to the process of predicting the quantity of goods and services that will be demanded by consumers at a future point in time. More specifically, the methods of demand forecasting entail using predictive analytics to estimate customer demand in consideration of key economic conditions. This is an important tool in optimizing business profitability through efficient supply chain management. Demand forecasting methods are divided into two major categories, qualitative and quantitative methods. Qualitative methods are based on expert opinion and information gathered from the field. This method is mostly used in situations when there is minimal data available for analysis such as when a business or product has recently been introduced to the market. Quantitative methods, however, use available data, and analytical tools in order to produce predictions. Demand forecasting may be used in resource allocation, inventory management, assessing future capacity requirements, or making decisions on whether to enter a new market.

EMSR stands for Expected Marginal Seat Revenue and is a very popular heuristic in Revenue Management. There are two versions: EMSRa and EMSRb, both of which were introduced by Peter Belobaba. Both methods are for n-class, static, single-resource problems. Because the models are static some assumptions apply: classes are indexed in such a way that the fare for the highest class, , is higher than the fare for the next highest class, , so > > ... > ; demand arrives in a strict low to high order in stages that are indexed with j as well; demand for class j is distributed with cdf . For simplicity it is also assumed that demand, capacity and the distributions are continuous, although it is not very difficult to drop this assumption.

<span class="mw-page-title-main">Riemann–Silberstein vector</span> Complex vector of electromagnetic fields

In mathematical physics, in particular electromagnetism, the Riemann–Silberstein vector or Weber vector named after Bernhard Riemann, Heinrich Martin Weber and Ludwik Silberstein, is a complex vector that combines the electric field E and the magnetic field B.

The base stock model is a statistical model in inventory theory. In this model inventory is refilled one unit at a time and demand is random. If there is only one replenishment, then the problem can be solved with the newsvendor model.

Non-homogeneous Gaussian regression (NGR) is a type of statistical regression analysis used in the atmospheric sciences as a way to convert ensemble forecasts into probabilistic forecasts. Relative to simple linear regression, NGR uses the ensemble spread as an additional predictor, which is used to improve the prediction of uncertainty and allows the predicted uncertainty to vary from case to case. The prediction of uncertainty in NGR is derived from both past forecast errors statistics and the ensemble spread. NGR was originally developed for site-specific medium range temperature forecasting, but has since also been applied to site-specific medium-range wind forecasting and to seasonal forecasts, and has been adapted for precipitation forecasting. The introduction of NGR was the first demonstration that probabilistic forecasts that take account of the varying ensemble spread could achieve better skill scores than forecasts based on standard Model output statistics approaches applied to the ensemble mean.

The (Q,r) model is a class of models in inventory theory. A general (Q,r) model can be extended from both the EOQ model and the base stock model

References

  1. 1 2 3 Monk, Ellen and Bret Wagner. Concepts in Enterprise Resource Planning. 3rd Edition. Boston: Course Technology Cengage Learning, 2009.
  2. The IOMA Handbook of Logistics and Inventory Management By Bob Donath, Institute of Management and Administration (Ioma), Institute of Management & Administration
  3. S. P. Meyn, 2007. Control Techniques for Complex Networks Archived 2008-05-13 at the Wayback Machine , Cambridge University Press, 2007.
  4. A Stitch in Time: Lean Retailing and the Transformation of Manufacturing By Frederick H. Abernathy
  5. Rooney, C., & Bangert, C. (2001, April). Developing the Right Approach to Requirements Planning Under ERP. Adhesives Age, 44(4), 49. Retrieved November 19, 2008, from Corporate ResourceNet database.
  6. Ronald H.Ballou, Business Logistics/Supply Chain Management, Fifth Edition
  7. Piasecki, Dave. "Optimizing Safety Stock". Inventoryops.com. Retrieved May 23, 2011.
  8. "R Glossary". Prenhall.com. Retrieved 2013-07-03.
  9. "deci_2396.tex" (PDF). Retrieved 2013-07-03.
  10. http://media.apics.org/omnow/Crack%20the%20Code.pdf [ bare URL PDF ]
  11. W. J. Hopp, M. L. Spearman, Factory Physics, 3rd ed.
  12. Baudin, Michel (2012-02-12). "Safety Stock: Beware of formulas" . Retrieved 2015-06-30.
  13. Hou, Billy (2014-01-29). "Four Common Pitfalls of Safety Stock". OPS Rules. Archived from the original on 2016-02-19. Retrieved 2022-09-18.
  14. Steven Nahmias, Production and Operation Analysis, Irwin 1989
  15. Ronald H. Ballou, Samir K. Srivastava, Business Logistics: Supply Chain Management, Pearson Education, 2007