San Luis, Pampanga

Last updated
San Luis
Municipality of San Luis
Sanluisjf1-c.jpg
Welcome Arc
Flag of San Luis, Pampanga.png
San Luis Pampanga.png
Ph locator pampanga san luis.png
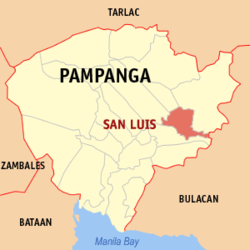
Map of Pampanga with San Luis highlighted
OpenStreetMap
San Luis, Pampanga
Philippines location map (square).svg
Red pog.svg
San Luis
Location within the Philippines
Coordinates: 15°02′24″N120°47′31″E / 15.04°N 120.7919°E / 15.04; 120.7919
Country Philippines
Region Central Luzon
Province Pampanga
District 4th district
Founded 1761
Barangays 17 (see Barangays)
Government
[1]
  Type Sangguniang Bayan
   Mayor Jayson S. Sagum
   Vice Mayor Roman A. Sagum
   Representative Anna York P. Bondoc
   Municipal Council
Members
   Electorate 36,761 voters (2022)
Area
[2]
  Total
56.83 km2 (21.94 sq mi)
Elevation
8.0 m (26.2 ft)
Highest elevation
25 m (82 ft)
Lowest elevation
2 m (7 ft)
Population
 (2020 census) [3]
  Total
58,551
  Density1,000/km2 (2,700/sq mi)
   Households
12,836
Economy
   Income class 3rd municipal income class
   Poverty incidence
11.86
% (2021) [4]
   Revenue 229.5 million (2022)
   Assets 632.2 million (2022)
   Expenditure 141.9 million (2022)
   Liabilities 159.7 million (2022)
Service provider
  ElectricityPampanga 1 Electric Cooperative (PELCO 1)
Time zone UTC+8 (PST)
ZIP code
2014
PSGC
IDD : area code +63(0)45
Native languages Kapampangan
Tagalog

San Luis, officially the Municipality of San Luis (Kapampangan : Balen ning San Luis; Tagalog : Bayan ng San Luis), is a municipality in the province of Pampanga, Philippines. According to the 2020 census, it had a population of 58,551 people. [3]

Contents

Geography

Barangays

San Luis is politically subdivided into 17 barangays. Each barangay consists of puroks and some have sitios.

  • San Agustín
  • San Carlos
  • San Isidro
  • San José
  • San Juan
  • San Nicolás
  • San Roque
  • San Sebastián
  • Santa Catalina
  • Santa Cruz Pambilog
  • Santa Cruz Población
  • Santa Lucia
  • Santa Mónica
  • Santa Rita
  • Santo Niño
  • Santo Rosario
  • Santo Tomás

Climate

Climate data for San Luis, Pampanga
MonthJanFebMarAprMayJunJulAugSepOctNovDecYear
Mean daily maximum °C (°F)28
(82)
29
(84)
31
(88)
33
(91)
32
(90)
31
(88)
30
(86)
29
(84)
29
(84)
30
(86)
30
(86)
28
(82)
30
(86)
Mean daily minimum °C (°F)20
(68)
20
(68)
21
(70)
23
(73)
24
(75)
24
(75)
24
(75)
24
(75)
24
(75)
23
(73)
22
(72)
21
(70)
23
(72)
Average precipitation mm (inches)6
(0.2)
4
(0.2)
6
(0.2)
17
(0.7)
82
(3.2)
122
(4.8)
151
(5.9)
123
(4.8)
124
(4.9)
99
(3.9)
37
(1.5)
21
(0.8)
792
(31.1)
Average rainy days3.32.53.66.617.722.225.223.723.217.99.25.2160.3
Source: Meteoblue [5]

Demographics

Population census of San Luis
YearPop.±% p.a.
1903 10,067    
1918 9,830−0.16%
1939 10,966+0.52%
1948 9,472−1.61%
1960 14,873+3.83%
1970 20,205+3.11%
1975 23,866+3.40%
1980 25,701+1.49%
YearPop.±% p.a.
1990 31,920+2.19%
1995 36,005+2.28%
2000 41,554+3.12%
2007 47,517+1.87%
2010 49,311+1.36%
2015 54,106+1.78%
2020 58,551+1.56%
Source: Philippine Statistics Authority [6] [7] [8] [9]

In the 2020 census, the population of San Luis, Pampanga, was 58,551 people, [3] with a density of 1,000 inhabitants per square kilometre or 2,600 inhabitants per square mile.

Like other municipalities and cities in Pampanga, its people are mostly Kapampangan.

Religion

Roman Catholicism remains the predominant faith of the townsfolk. Other Christian denominations, such as Iglesia ni Cristo, the United Methodist Church, Members Church of God International, Evangelicals, Ang Iglesia Metodista sa Pilipinas, Baptists, and Born Again Christianity can be found in the municipality.

Economy

Poverty incidence of San Luis

10
20
30
40
2000
35.90
2003
15.75
2006
20.30
2009
16.20
2012
6.02
2015
9.61
2018
6.01
2021
11.86

Source: Philippine Statistics Authority [10] [11] [12] [13] [14] [15] [16] [17]

Transportation, trade and commerce in San Luis is concentrated at the town center where the public market, cockpit, municipal hall, church, schools, hospital, clinics, and commercial spaces are situated.

Government

Local government

The municipal government is divided into three branches: executive, legislative and judiciary. The judicial branch is administered solely by the Supreme Court of the Philippines. The executive branch is composed of the mayor and the barangay captains for the barangays. The legislative branch is composed of the Sangguniang Bayan (town assembly), Sangguniang Barangay (barangay council), and the Sangguniang Kabataan for the youth sector.

The current mayor of San Luis, Dr. Jayson S. Sagum or also known as Dr. J, and the vice mayor is Mon A. Sagum.

Landmarks

St. Aloysius Gonzaga Church (2008 photo) St. Aloysius Gonzaga Parish.JPG
St. Aloysius Gonzaga Church (2008 photo)

St. Aloysius Gonzaga Church

Its façade can compare immeasurably with existing Spanish-style church edifices and architectural design. The church is located in a place that used to be called Cabagsac, referring to the proliferation of fruit bats. In fact, today, a fishnet is permanently installed high above the altar precisely to catch thousands of bats that are roosting inside the church. There is an ancient cemetery located in a hidden corner at the back of the church, with some tombstones dating back to the 1800s and bearing the names of the town's prominent families, including the Elizaldes, Ablazos, Francos, Tarucs, among others. [18]

Notable personalities

References

  1. Municipality of San Luis | (DILG)
  2. "2015 Census of Population, Report No. 3 – Population, Land Area, and Population Density" (PDF). Philippine Statistics Authority. Quezon City, Philippines. August 2016. ISSN   0117-1453. Archived (PDF) from the original on May 25, 2021. Retrieved July 16, 2021.
  3. 1 2 3 Census of Population (2020). "Region III (Central Luzon)". Total Population by Province, City, Municipality and Barangay. Philippine Statistics Authority . Retrieved 8 July 2021.
  4. "PSA Releases the 2021 City and Municipal Level Poverty Estimates". Philippine Statistics Authority. 2 April 2024. Retrieved 28 April 2024.
  5. "San Luis: Average Temperatures and Rainfall". Meteoblue. Retrieved 5 May 2020.
  6. Census of Population (2015). "Region III (Central Luzon)". Total Population by Province, City, Municipality and Barangay. Philippine Statistics Authority . Retrieved 20 June 2016.
  7. Census of Population and Housing (2010). "Region III (Central Luzon)" (PDF). Total Population by Province, City, Municipality and Barangay. National Statistics Office . Retrieved 29 June 2016.
  8. Censuses of Population (1903–2007). "Region III (Central Luzon)". Table 1. Population Enumerated in Various Censuses by Province/Highly Urbanized City: 1903 to 2007. National Statistics Office.
  9. "Province of Pampanga". Municipality Population Data. Local Water Utilities Administration Research Division. Retrieved 17 December 2016.
  10. "Poverty incidence (PI):". Philippine Statistics Authority. Retrieved December 28, 2020.
  11. "Estimation of Local Poverty in the Philippines" (PDF). Philippine Statistics Authority. 29 November 2005.
  12. "2003 City and Municipal Level Poverty Estimates" (PDF). Philippine Statistics Authority. 23 March 2009.
  13. "City and Municipal Level Poverty Estimates; 2006 and 2009" (PDF). Philippine Statistics Authority. 3 August 2012.
  14. "2012 Municipal and City Level Poverty Estimates" (PDF). Philippine Statistics Authority. 31 May 2016.
  15. "Municipal and City Level Small Area Poverty Estimates; 2009, 2012 and 2015". Philippine Statistics Authority. 10 July 2019.
  16. "PSA Releases the 2018 Municipal and City Level Poverty Estimates". Philippine Statistics Authority. 15 December 2021. Retrieved 22 January 2022.
  17. "PSA Releases the 2021 City and Municipal Level Poverty Estimates". Philippine Statistics Authority. 2 April 2024. Retrieved 28 April 2024.
  18. "WOW Philippines :: Explore Philippines :: Things to Do" . Retrieved 2008-04-25. Note: Things to Do and see in Pampanga...