Skircoat | |
---|---|
2004 Boundaries of Skircoat Ward | |
Population | 12,712 (2011 census) [1] |
Metropolitan borough | |
Metropolitan county | |
Region | |
Country | England |
Sovereign state | United Kingdom |
Police | West Yorkshire |
Fire | West Yorkshire |
Ambulance | Yorkshire |
EU Parliament | Yorkshire and the Humber |
UK Parliament | |
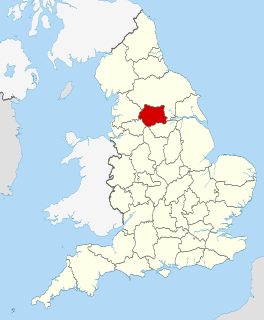
Skircoat is an electoral ward in Calderdale, West Yorkshire, England, and returns three members to sit on Calderdale Metropolitan Borough Council. The population at the 2011 Census was 12,712. [1] It covers the area of Skircoat Green.
The Metropolitan Borough of Calderdale is a metropolitan borough of West Yorkshire, England. It takes its name from the River Calder, whose upper part flows through the borough. Several small valleys contain tributaries of the River Calder. The population at the 2011 Census was 203,826.
West Yorkshire is a metropolitan county in England. It is an inland and in relative terms upland county having eastward-draining valleys while taking in moors of the Pennines and has a population of 2.2 million. West Yorkshire came into existence as a metropolitan county in 1974 after the passage of the Local Government Act 1972.
England is a country that is part of the United Kingdom. It shares land borders with Wales to the west and Scotland to the north. The Irish Sea lies west of England and the Celtic Sea to the southwest. England is separated from continental Europe by the North Sea to the east and the English Channel to the south. The country covers five-eighths of the island of Great Britain, which lies in the North Atlantic, and includes over 100 smaller islands, such as the Isles of Scilly and the Isle of Wight.
Election | 2004 | 2006 | 2007 | 2008 | 2009 | 2010 | 2011 | 2012 | 2014 | 2015 | 2016 | 2018 | 2019 | |||||||||||||
---|---|---|---|---|---|---|---|---|---|---|---|---|---|---|---|---|---|---|---|---|---|---|---|---|---|---|
Councillor, party | Geoffrey Wainwright, Conservative | John Hardy, Conservative | ||||||||||||||||||||||||
Councillor, party | John Ford, Conservative | Stephen Gow, Liberal Democrats | Marcus Thompson, Conservative | Mike Barnes, Labour | ||||||||||||||||||||||
Councillor, party | Grenville Horsfall, Conservative | Pauline Nash, Liberal Democrats | Andrew Tagg, Conservative | Colin Hutchinson, Labour |
The percentage changes are calculated in comparison to the party performances in the previous election.
The incumbent was Marcus Thompson for the Conservative Party who stood down at this election.
Party | Candidate | Votes | % | ± | |
---|---|---|---|---|---|
Labour Co-op | Mike Barnes | 1725 | 42.0 | -4.8 | |
Conservative | Jeff Featherstone | 1257 | 30.6 | -14.9 | |
Independent | John Joseph Wainwright | 625 | 15.2 | +15.2 | |
Liberal Democrat | Alexander Nigel Sutcliffe | 239 | 5.8 | +1.3 | |
Green | Finn Mygind Jensen | 231 | 5.6 | +2.7 | |
Majority | 468 | 11.4 | +10.1 | ||
Turnout | 4,103 | 42.7 | -2.5 | ||
Labour gain from Conservative | Swing | ||||
The incumbent was Andrew Tagg for the Conservative Party.
Party | Candidate | Votes | % | ± | |
---|---|---|---|---|---|
Labour | Colin Hugh Hutchinson | 2,017 | 46.8 | +17.3 | |
Conservative | Andrew James Tagg | 1,963 | 45.5 | +1.5 | |
Liberal Democrat | Sean William Bamforth | 196 | 4.5 | -8.9 | |
Green | Anne Marie Nelson | 127 | 2.9 | -0.7 | |
Majority | 54 | 1.3 | -13.2 | ||
Turnout | 4,312 | 45.2 | +4.8 | ||
Labour gain from Conservative | Swing | ||||
The incumbent was John Hardy for the Conservative Party.
Party | Candidate | Votes | % | ± | |
---|---|---|---|---|---|
Conservative | John Cecil David Hardy | 1,660 | 44.0 | -3.8 | |
Labour | Dave Draycott | 1,113 | 29.5 | +3.4 | |
Liberal Democrat | Stephen Alexander Gow | 507 | 13.4 | +4.1 | |
UKIP | Geoffrey Thompson | 293 | 7.8 | +7.8 | |
Green | Eric Dolphy Fabrizi | 136 | 3.6 | -5.7 | |
Yorkshire Party | Darren Stansfield | 56 | 1.5 | +1.5 | |
Majority | 547 | 14.5 | -7.2 | ||
Turnout | 3,775 | 40.4 | -29.3 | ||
Conservative hold | Swing |
The incumbent was Marcus Thompson for the Conservative Party.
Party | Candidate | Votes | % | ± | |
---|---|---|---|---|---|
Conservative | Marcus Joseph Thompson | 3,185 | 47.8 | +13.7 | |
Labour | Mohammad Naeem | 1,740 | 26.1 | +4.8 | |
Liberal Democrat | Stephen Alexander Gow | 1,033 | 15.5 | -3.5 | |
Green | Gary Michael Scott | 622 | 9.3 | -1.1 | |
Majority | 1,445 | 21.7 | +8.8 | ||
Turnout | 6,658 | 69.7 | +31.1 | ||
Conservative hold | Swing |
The incumbent was Pauline Nash for the Liberal Democrats.
Party | Candidate | Votes | % | ± | |
---|---|---|---|---|---|
Conservative | Andrew Tagg | 1,252 | 34.1 | -6.9 | |
Labour | Alistair John Millington | 780 | 21.3 | 0.0 | |
Liberal Democrat | Margaret Pauline Elizabeth Nash | 696 | 19.0 | -11.3 | |
UKIP | Grenville Horsfall | 628 | 17.1 | +17.1 | |
Green | Gary Michael Scott | 300 | 8.2 | +1.3 | |
Majority | 472 | 12.9 | +2.2 | ||
Turnout | 3,668 | 38.6 | +0.2 | ||
Conservative gain from Liberal Democrat | Swing | ||||
The incumbent was John Hardy for the Conservative Party.
Party | Candidate | Votes | % | ± | |
---|---|---|---|---|---|
Conservative | John Cecil David Hardy | 1,496 | 41.0 | +4.5 | |
Liberal Democrat | Stephen Gow | 1,104 | 30.3 | -2.0 | |
Labour | Alistair John Millington | 778 | 21.3 | -1.6 | |
Green | Charles Gate | 251 | 6.9 | -0.9 | |
Majority | 392 | 10.7 | +6.5 | ||
Turnout | 3,647 | 38.4 | -7.5 | ||
Conservative hold | Swing |
The incumbent was Stephen Gow for the Liberal Democrats.
Party | Candidate | Votes | % | ± | |
---|---|---|---|---|---|
Conservative | Marcus Joseph Chance Thompson | 1,584 | 36.5 | +1.1 | |
Liberal Democrat | Stephen Gow | 1,401 | 32.3 | -9.3 | |
Labour Co-op | Anne Collins | 993 | 22.9 | +5.9 | |
Green | Charles Gate | 339 | 7.8 | +2.9 | |
Majority | 183 | 4.2 | -2.1 | ||
Turnout | 4,335 | 45.9 | -22.7 | ||
Conservative gain from Liberal Democrat | Swing | ||||
The incumbent was Grenville Horsfall for the Conservative Party.
Party | Candidate | Votes | % | ± | |
---|---|---|---|---|---|
Liberal Democrat | Pauline Nash | 2,748 | 41.6 | +8.1 | |
Conservative | Sheila Ruth Helen Jackson | 2,334 | 35.4 | -1.4 | |
Labour Co-op | Anne Collins | 1,124 | 17.0 | +9.4 | |
Green | Charles Gate | 324 | 4.9 | +2.3 | |
Majority | 414 | 6.3 | +3.0 | ||
Turnout | 6,602 | 68.6 | +30.5 | ||
Liberal Democrat gain from Conservative | Swing | ||||
The incumbent was Geoffrey Wainwright for the Conservative Party. The by-election was triggered by his sudden death. [10]
Party | Candidate | Votes | % | ± | |
---|---|---|---|---|---|
Conservative | John Cecil David Hardy | 1,327 | 36.8 | -17.2 | |
Liberal Democrat | Pauline Nash | 1,209 | 33.5 | +0.4 | |
Labour | Anne Collins | 274 | 7.6 | -0.2 | |
Independent | Paul Brannigan | 238 | 6.6 | +6.6 | |
BNP | Chris Godridge | 235 | 6.5 | +6.5 | |
Independent | Philip Maxwell Crossley | 229 | 6.4 | +6.4 | |
Green | Viv Smith | 92 | 2.6 | -2.5 | |
Majority | 118 | 3.3 | -17.7 | ||
Turnout | 3,608 | 38.1 | -4.1 | ||
Conservative hold | Swing |
The incumbent was Geoffrey Wainwright for the Conservative Party.
Party | Candidate | Votes | % | ± | |
---|---|---|---|---|---|
Conservative | Geoffrey Wainwright | 2,132 | 54.0 | +21.0 | |
Liberal Democrat | Pauline Nash | 1,305 | 33.1 | -10.4 | |
Labour Co-op | Marion Simone Batten | 308 | 7.8 | -3.6 | |
Green | Viv Smith | 202 | 5.1 | +1.1 | |
Majority | 827 | 21.0 | +10.5 | ||
Turnout | 3,947 | 42.2 | -0.4 | ||
Conservative hold | Swing |
The incumbent was John Ford for the Conservative Party.
Party | Candidate | Votes | % | ± | |
---|---|---|---|---|---|
Liberal Democrat | Stephen Alexander Gow | 1,716 | 43.5 | +3.2 | |
Conservative | John Frank Brearley Ford | 1,301 | 33.0 | -7.5 | |
Labour | Anne Collins | 449 | 11.4 | +2.0 | |
BNP | Anthony Shane Bentley | 317 | 8.0 | +8.0 | |
Green | Simon Christopher Turner | 159 | 4.0 | -5.4 | |
Majority | 415 | 10.5 | +10.2 | ||
Turnout | 3,951 | 42.6 | +3.5 | ||
Liberal Democrat gain from Conservative | Swing | ||||
The incumbent was Grenville Horsfal for the Conservative Party.
Party | Candidate | Votes | % | ± | |
---|---|---|---|---|---|
Conservative | Grenville Horsfall | 1,419 | 40.5 | -14.5 | |
Liberal Democrat | Stephen Alexander Gow | 1,410 | 40.3 | +20.4 | |
Green | Vivienne Patricia Smith | 343 | 9.8 | +9.8 | |
Labour | Mohammed Ilyas Najib | 330 | 9.4 | -10.8 | |
Majority | 9 | 0.3 | -34.6 | ||
Turnout | 3,534 | 39.1 | |||
Conservative hold | Swing |
The ward was created after boundary changes in the 2004 election. All three councillor posts were up for election and each elector had three votes.
Party | Candidate | Votes | % | ± | |
---|---|---|---|---|---|
Conservative | Geoffrey Wainwright | 2,367 | 20.08 | - | |
Conservative | John Frank Brearley Ford | 2,167 | 18.4 | - | |
Conservative | Grenville Horsfall | 1,948 | 16.5 | - | |
Liberal Democrat | Stephen Alexander Gow | 1,002 | 8.5 | - | |
Labour | David Charles Russell | 862 | 7.3 | - | |
Liberal Democrat | Sheila Jackson | 782 | 6.6 | - | |
Labour | James Frederick Wilson | 759 | 6.4 | - | |
Labour | Maura Wilson | 754 | 6.4 | - | |
BNP | Stuart Brian Gill | 582 | 4.9 | - | |
Liberal Democrat | Rafael Hassan Babar | 561 | 4.8 | - | |
Turnout | 4,518 | - |
The same results expressed by party
Skircoat Ward 2004 | |||||
---|---|---|---|---|---|
List | Candidates | Votes | % | ± | |
Conservative | Geoffrey Wainwright John Ford Grenville Horsfall | 6,482 | 55.0 | - | |
Labour | - | 2,375 | 20.2 | - | |
Liberal Democrat | - | 2,345 | 19.9 | - | |
BNP | - | 582 | 4.9 | - | |
Majority | 4,107 | 34.9 | - | ||
Turnout | 4,518 | - |
Elections to Calderdale Metropolitan Borough Council were held on 1 May 2008. One third of the council was up for election and the council stayed under no overall control with a minority Conservative administration.
Elections to Calderdale Metropolitan Borough Council were held on 4 May 2006. One third of the council was up for election and the council stayed under no overall control with a minority Conservative administration.
Elections to Calderdale Metropolitan Borough Council were held on 4 May 2000. One third of the council was up for election and the Conservative party gained overall control of the council from no overall control. The total turnout of the election was 28.97%. The winning candidate in each ward is highlighted in bold.
Elections to Calderdale Metropolitan Borough Council were held on 3 May 2007 with the exception of the Warley ward which was postponed until 14 June 2007 due to the sudden death of one of the candidates. One third of the council was up for election and the council stayed under no overall control with a minority Conservative administration. The total turnout of the election was 38.01%. The winning candidate in each ward is highlighted in bold.
Local elections were held in the United Kingdom in 1980. These were the first annual local elections for the new Conservative Prime Minister Margaret Thatcher. Though the Conservatives in government lost seats, the projected share of the vote was close: Labour Party 42%, Conservative Party 40%, Liberal Party 13%. Labour were still being led by the former prime minister James Callaghan, who resigned later in the year to be succeeded by Michael Foot.
The 2007 Sandwell Metropolitan Borough Council election took place on 3 May 2007 to elect members of Sandwell Metropolitan Borough Council in the West Midlands, England. One third of the council was up for election and the Labour party stayed in overall control of the council.
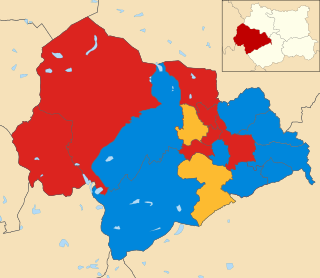
Elections to Calderdale Metropolitan Borough Council took place on Thursday 5 May 2011.
The 2010 Calderdale Metropolitan Borough Council election took place on 6 May 2010 to elect members of Calderdale Metropolitan Borough Council in England. This was on the same day as other local elections and a general election. One councillor was elected in each ward for a four-year term so the councillors elected in 2010 last stood for election in 2006. Each ward is represented by three councillors, the election of which is staggered, so only one third of the councillors was elected in this election. After the election the council stayed in no overall control but the Conservative minority administration was replaced with a coalition between Labour and the Liberal Democrats.
The 2012 Calderdale Metropolitan Borough Council election took place on 3 May 2012 to elect members of Calderdale Metropolitan Borough Council in West Yorkshire, England. This was on the same day as other 2012 United Kingdom local elections. After the election the council continued to have no overall control and continue to be run by a coalition between the Labour Party and the Liberal Democrats.
Wirral Metropolitan Borough Council, or simply Wirral Council, is the local authority of the Metropolitan Borough of Wirral in Merseyside, England. It is a metropolitan district council, one of five in Merseyside and one of 36 in the metropolitan counties of England, and provides the majority of local government services in Wirral. It is a constituent council of Liverpool City Region Combined Authority.
Calderdale Metropolitan Borough Council is the local authority of the Metropolitan Borough of Calderdale in West Yorkshire, England. It is a metropolitan district council, one of five in West Yorkshire and one of 36 in the metropolitan counties of England, and provides the majority of local government services in Calderdale. Since 1 April 2014 it has been a constituent council of the West Yorkshire Combined Authority.
The 2014 Calderdale Metropolitan Borough Council election took place on 22 May 2014 to elect members of Calderdale Metropolitan Borough Council in England. This was on the same day as local elections across the United Kingdom and a European election. One councillor was elected in each of the 17 wards for a four-year term. There are three councillors representing each ward elected on a staggered basis so one third of the councillor seats were up for re-election. The seats had previously been contested in 2010 which was held in conjunction with a general election. The turnout was significantly lower in 2014 than in 2010 which is not unusual when comparing local elections that coincide with general elections to ones that do not. Prior to the election Labour was the largest party in the council with 21 out of 51 seats, 5 seats short of an overall majority. After the election there was no overall control of the council. Labour had 25 seats, only one short of a majority and so Labour continued to operate a minority administration.
The by-thirds 2015 Rotherham Metropolitan Borough Council election took place on Thursday 7 May 2015, to elect approximately one third of the members of the Rotherham Metropolitan Borough Council in England as part of the 2015 United Kingdom local elections held on the same day as the general election. All seats contested at this election were last contested in 2011, and of these, 20 were held by Labour Party councillors.
The 2015 Calderdale Metropolitan Borough Council election took place on 7 May 2015 to elect members of Calderdale in England. This was on the same day as other local elections and a general election. One councillor was elected in each ward for a four-year term so the councillors elected in 2015 last stood for election in 2011. Each ward is represented by three councillors, the election of which is staggered, so only one third of the councillors were elected in this election. Before the election there was no overall control with a minority Labour administration which was over-ruled at a Budget vote by a coalition of Conservatives & Liberal Democrats leading to a Conservative minority administration. After the election there was still no overall control & a Labour minority administration was formed again.
The 2016 Calderdale Metropolitan Borough Council election took place on 5 May 2016 to elect members of Calderdale Metropolitan Borough Council in England. This was on the same day as other local elections. One councillor was elected in each ward for a four-year term so the councillors elected in 2016 last stood for election in 2012. Each ward is represented by three councillors, the election of which is staggered, so only one third of the councillors was elected in this election. Before the election there was no overall control with a minority Labour administration. After the election there was still no overall control so the minority Labour administration continued.
The first elections to the newly created Calderdale Metropolitan Borough Council were held on 10 May 1973, with the entirety of the 51 seat council — three seats for each of the 17 wards — up for vote. The Local Government Act 1972 stipulated that the elected members were to shadow and eventually take over from the predecessor corporation on 1 April 1974. The order in which the councillors were elected dictated their term serving, with third-place candidates serving two years and up for re-election in 1975, second-placed three years expiring in 1976 and 1st-placed five years until 1978.
Prenton is a Wirral Metropolitan Borough Council Ward in the Birkenhead Parliamentary constituency.
The 2018 Calderdale Metropolitan Borough Council election took place on 3 May 2018 to elect members of Calderdale Metropolitan Borough Council in England. This was on the same day as other local elections. One councillor was elected in each ward for a four-year term so the councillors elected in 2018 last stood for election in 2014. Each ward is represented by three councillors, the election of which is staggered, so only one third of the councillors were elected in this election. Before the election there was no overall control with a minority Labour administration. Following the election Labour, having gained one councillor, was still two councillors away from a majority so it remained no overall control.
The 2019 Calderdale Metropolitan Borough Council election took place on 2 May 2019 to elect members of Calderdale Metropolitan Borough Council in England. This was on the same day as other local elections. One councillor was elected in each ward for a four-year term so the councillors elected in 2019 last stood for election in 2015. Each ward is represented by three councillors, the election of which is staggered, so only one third of the councillors were elected in this election. Before the election there was no overall control with a minority Labour administration. Following the election Labour, having gained four councillors, took control of the council with an overall majority of five seats.