
Many countries and territories have installed significant solar power capacity into their electrical grids to supplement or provide an alternative to conventional energy sources. Solar power plants use one of two technologies:

Spain is one of the first countries to deploy large-scale solar photovoltaics, and is the world leader in concentrated solar power (CSP) production.

Solar power represented a very small part of electricity production in the United Kingdom until the 2010s when it increased rapidly, thanks to feed-in tariff (FIT) subsidies and the falling cost of photovoltaic (PV) panels.

Solar power is a growing source in the Portuguese energy mix. At the end of 2020, solar power installed capacity totalled 1.03 GW and represented 3.6% of total power generation in 2020.

Renewable energy in Finland grew to 38.7% of total final energy consumption by year end 2014, achieving joint second position with Latvia in terms of renewable energy consumption by share amongst the EU-28 countries, behind its neighbour Sweden in first position on a 52.6% share. The 2014 share in Finland breaks down as renewable energy providing 52% of the heating and cooling sector, 31.4% of the electricity sector and 21.6% of the transport sector. By 2014, Finland had already exceeded its 2020 target for renewable energy use under the EU renewable energy directive as shown in the table of country targets.
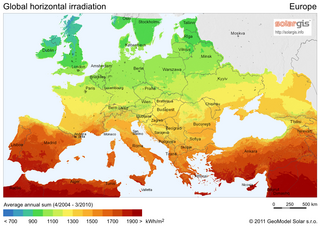
Solar power consists of photovoltaics (PV) and solar thermal energy in the European Union.
China is the largest market in the world for both photovoltaics and solar thermal energy. China's photovoltaic industry began by making panels for satellites, and transitioned to the manufacture of domestic panels in the late 1990s. After substantial government incentives were introduced in 2011, China's solar power market grew dramatically: the country became the world's leading installer of photovoltaics in 2013. China surpassed Germany as the world's largest producer of photovoltaic energy in 2015, and became the first country to have over 100 GW of total installed photovoltaic capacity in 2017.
The nominal power is the nameplate capacity of photovoltaic (PV) devices, such as solar cells, modules and systems, and is determined by measuring the electric current and voltage in a circuit, while varying the resistance under precisely defined conditions. The nominal power is important for designing an installation in order to correctly dimension its cabling and converters.

Historically, the main applications of solar energy technologies in Canada have been non-electric active solar system applications for space heating, water heating and drying crops and lumber. In 2001, there were more than 12,000 residential solar water heating systems and 300 commercial/ industrial solar hot water systems in use. These systems presently comprise a small fraction of Canada's energy use, but some government studies suggest they could make up as much as five percent of the country's energy needs by the year 2025.
Worldwide growth of photovoltaics has been close to exponential between 1992 and 2018. During this period of time, photovoltaics (PV), also known as solar PV, evolved from a niche market of small-scale applications to a mainstream electricity source.
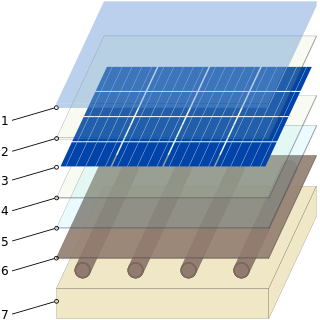
Photovoltaic thermal collectors, typically abbreviated as PVT collectors and also known as hybrid solar collectors, photovoltaic thermal solar collectors, PV/T collectors or solar cogeneration systems, are power generation technologies that convert solar radiation into usable thermal and electrical energy. PVT collectors combine photovoltaic solar cells, which convert sunlight into electricity, with a solar thermal collector, which transfers the otherwise unused waste heat from the PV module to a heat transfer fluid. By combining electricity and heat generation within the same component, these technologies can reach a higher overall efficiency than solar photovoltaic (PV) or solar thermal (T) alone.

Solar power has been growing rapidly in the U.S. state of California because of high insolation, community support, declining solar costs, and a renewable portfolio standard which requires that 60% of California's electricity come from renewable resources by 2030, with 100% by 2045. Much of this is expected to come from solar power via photovoltaic facilities or concentrated solar power facilities.

As of the end of 2014, solar power in Austria amounted to 766 megawatt (MW) of cumulative photovoltaic (PV) capacity, of which more than three quarters were installed within the last four years. Solar PV generated 766 gigawatt-hours, or about 1.4% of the country's final electricity consumption. As with most other European countries, 99.5 percent of all solar power systems are connected to the electrical grid. The nation's installed PV capacity by inhabitant stood at 91 watts, still below the European Union's 2014-average of 172 watts.

Solar power in France including overseas territories reached an installed capacity figure of 11.2 GW by the end of 2020.

Solar power in Mexico has the potential to produce vast amounts of energy. 70% of the country has an insolation of greater than 4.5 kWh/m2/day. Using 15% efficient photovoltaics, a square 25 km (16 mi) on each side in the state of Chihuahua or the Sonoran Desert could supply all of Mexico's electricity.

Solar power in South Africa includes photovoltaics (PV) as well as concentrated solar power (CSP). In 2016, South Africa had 1,329 MW of installed solar power capacity. Installed capacity is expected to reach 8,400 MW by 2030.

Solar power in Belgium reached an installed capacity of 4,254 MW of power generating 3,563 GWh of electricity in 2018. In 2015 PV solar power accounted for around 4% of Belgium's total electricity demand, the 4th highest penetration figure in the world, although the country is some way behind the leaders Germany, Italy and Greece at between 7% and 8% of electricity demand.

Solar power in Denmark is at 2,339 MW (grid-connected) by mid-2022, and contributes to a goal to use 100% renewable energy by 2050. The goal of 200 MW of photovoltaics by 2020 was reached eight years early, in 2012, and 36 MW was being installed each month. Denmark had 790 MW in late 2015. A total of 3,400 MW is expected to be installed by 2030. Many solar-thermal district heating plants exist and are planned in Denmark.
Under its commitment to the EU renewable energy directive of 2009, France has a target of producing 23% of its total energy needs from renewable energy by 2020. This figure breaks down to renewable energy providing 33% of energy used in the heating and cooling sector, 27% of the electricity sector and 10.5% in the transport sector. By the end of 2014, 14.3% of France's total energy requirements came from renewable energy, a rise from 9.6% in 2005.
In 2022 Chile produced about 18% of its electricity from solar power, up from 7% in 2018. As of 2022, Chile produces the highest percentage of its electricity from solar in the world. At the end of 2021 Chile was ranked 22nd in the world in terms of installed solar energy.

