
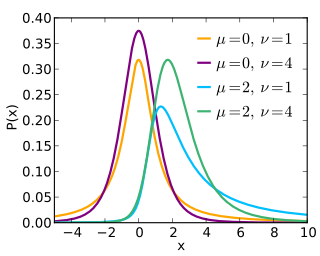
In probability and statistics, Student's t distribution is a continuous probability distribution that generalizes the standard normal distribution. Like the latter, it is symmetric around zero and bell-shaped.

An F-test is any statistical test used to compare the variances of two samples or the ratio of variances between multiple samples. The test statistic, random variable F, is used to determine if the tested data has an F-distribution under the true null hypothesis, and true customary assumptions about the error term (ε). It is most often used when comparing statistical models that have been fitted to a data set, in order to identify the model that best fits the population from which the data were sampled. Exact "F-tests" mainly arise when the models have been fitted to the data using least squares. The name was coined by George W. Snedecor, in honour of Ronald Fisher. Fisher initially developed the statistic as the variance ratio in the 1920s.
In statistics, an effect size is a value measuring the strength of the relationship between two variables in a population, or a sample-based estimate of that quantity. It can refer to the value of a statistic calculated from a sample of data, the value of a parameter for a hypothetical population, or to the equation that operationalizes how statistics or parameters lead to the effect size value. Examples of effect sizes include the correlation between two variables, the regression coefficient in a regression, the mean difference, or the risk of a particular event happening. Effect sizes complement statistical hypothesis testing, and play an important role in power analyses, sample size planning, and in meta-analyses. The cluster of data-analysis methods concerning effect sizes is referred to as estimation statistics.
Student's t-test is a statistical test used to test whether the difference between the response of two groups is statistically significant or not. It is any statistical hypothesis test in which the test statistic follows a Student's t-distribution under the null hypothesis. It is most commonly applied when the test statistic would follow a normal distribution if the value of a scaling term in the test statistic were known. When the scaling term is estimated based on the data, the test statistic—under certain conditions—follows a Student's t distribution. The t-test's most common application is to test whether the means of two populations are significantly different. In many cases, a Z-test will yield very similar results to a t-test since the latter converges to the former as the size of the dataset increases.
In probability and statistics, a mixture distribution is the probability distribution of a random variable that is derived from a collection of other random variables as follows: first, a random variable is selected by chance from the collection according to given probabilities of selection, and then the value of the selected random variable is realized. The underlying random variables may be random real numbers, or they may be random vectors, in which case the mixture distribution is a multivariate distribution.
The Mahalanobis distance is a measure of the distance between a point and a distribution , introduced by P. C. Mahalanobis in 1936. Mahalanobis's definition was prompted by the problem of identifying the similarities of skulls based on measurements in 1927.

In statistics, a multimodaldistribution is a probability distribution with more than one mode. These appear as distinct peaks in the probability density function, as shown in Figures 1 and 2. Categorical, continuous, and discrete data can all form multimodal distributions. Among univariate analyses, multimodal distributions are commonly bimodal.
In statistics, Duncan's new multiple range test (MRT) is a multiple comparison procedure developed by David B. Duncan in 1955. Duncan's MRT belongs to the general class of multiple comparison procedures that use the studentized range statistic qr to compare sets of means.
The noncentral t-distribution generalizes Student's t-distribution using a noncentrality parameter. Whereas the central probability distribution describes how a test statistic t is distributed when the difference tested is null, the noncentral distribution describes how t is distributed when the null is false. This leads to its use in statistics, especially calculating statistical power. The noncentral t-distribution is also known as the singly noncentral t-distribution, and in addition to its primary use in statistical inference, is also used in robust modeling for data.
In statistics, a binomial proportion confidence interval is a confidence interval for the probability of success calculated from the outcome of a series of success–failure experiments. In other words, a binomial proportion confidence interval is an interval estimate of a success probability when only the number of experiments and the number of successes are known.
In statistics, Levene's test is an inferential statistic used to assess the equality of variances for a variable calculated for two or more groups. This test is used because some common statistical procedures assume that variances of the populations from which different samples are drawn are equal. Levene's test assesses this assumption. It tests the null hypothesis that the population variances are equal. If the resulting p-value of Levene's test is less than some significance level (typically 0.05), the obtained differences in sample variances are unlikely to have occurred based on random sampling from a population with equal variances. Thus, the null hypothesis of equal variances is rejected and it is concluded that there is a difference between the variances in the population.
Omnibus tests are a kind of statistical test. They test whether the explained variance in a set of data is significantly greater than the unexplained variance, overall. One example is the F-test in the analysis of variance. There can be legitimate significant effects within a model even if the omnibus test is not significant. For instance, in a model with two independent variables, if only one variable exerts a significant effect on the dependent variable and the other does not, then the omnibus test may be non-significant. This fact does not affect the conclusions that may be drawn from the one significant variable. In order to test effects within an omnibus test, researchers often use contrasts.
In statistics, Welch's t-test, or unequal variances t-test, is a two-sample location test which is used to test the (null) hypothesis that two populations have equal means. It is named for its creator, Bernard Lewis Welch, is an adaptation of Student's t-test, and is more reliable when the two samples have unequal variances and possibly unequal sample sizes. These tests are often referred to as "unpaired" or "independent samples" t-tests, as they are typically applied when the statistical units underlying the two samples being compared are non-overlapping. Given that Welch's t-test has been less popular than Student's t-test and may be less familiar to readers, a more informative name is "Welch's unequal variances t-test" — or "unequal variances t-test" for brevity.
In statistics, D'Agostino's K2 test, named for Ralph D'Agostino, is a goodness-of-fit measure of departure from normality, that is the test aims to gauge the compatibility of given data with the null hypothesis that the data is a realization of independent, identically distributed Gaussian random variables. The test is based on transformations of the sample kurtosis and skewness, and has power only against the alternatives that the distribution is skewed and/or kurtic.
In probability and statistics, the Hellinger distance is used to quantify the similarity between two probability distributions. It is a type of f-divergence. The Hellinger distance is defined in terms of the Hellinger integral, which was introduced by Ernst Hellinger in 1909.

In probability and statistics, studentized range distribution is the continuous probability distribution of the studentized range of an i.i.d. sample from a normally distributed population.
In statistics, Scheffé's method, named after American statistician Henry Scheffé, is a method for adjusting significance levels in a linear regression analysis to account for multiple comparisons. It is particularly useful in analysis of variance, and in constructing simultaneous confidence bands for regressions involving basis functions.
Named after the Dutch mathematician Bartel Leendert van der Waerden, the Van der Waerden test is a statistical test that k population distribution functions are equal. The Van der Waerden test converts the ranks from a standard Kruskal-Wallis test to quantiles of the standard normal distribution. These are called normal scores and the test is computed from these normal scores.
The Newman–Keuls or Student–Newman–Keuls (SNK)method is a stepwise multiple comparisons procedure used to identify sample means that are significantly different from each other. It was named after Student (1927), D. Newman, and M. Keuls. This procedure is often used as a post-hoc test whenever a significant difference between three or more sample means has been revealed by an analysis of variance (ANOVA). The Newman–Keuls method is similar to Tukey's range test as both procedures use studentized range statistics. Unlike Tukey's range test, the Newman–Keuls method uses different critical values for different pairs of mean comparisons. Thus, the procedure is more likely to reveal significant differences between group means and to commit type I errors by incorrectly rejecting a null hypothesis when it is true. In other words, the Neuman-Keuls procedure is more powerful but less conservative than Tukey's range test.
In statistics, Tukey's test of additivity, named for John Tukey, is an approach used in two-way ANOVA to assess whether the factor variables are additively related to the expected value of the response variable. It can be applied when there are no replicated values in the data set, a situation in which it is impossible to directly estimate a fully general non-additive regression structure and still have information left to estimate the error variance. The test statistic proposed by Tukey has one degree of freedom under the null hypothesis, hence this is often called "Tukey's one-degree-of-freedom test."


