Univariate distribution

Last updated

In statistics, a univariate distribution is a probability distribution of only one random variable. This is in contrast to a multivariate distribution, the probability distribution of a random vector (consisting of multiple random variables).

Contents

Examples

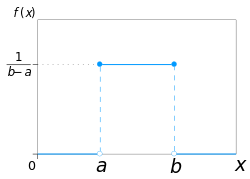
Continuous uniform distribution Uniform distribution.svg
Continuous uniform distribution

One of the simplest examples of a discrete univariate distribution is the discrete uniform distribution, where all elements of a finite set are equally likely. It is the probability model for the outcomes of tossing a fair coin, rolling a fair die, etc. The univariate continuous uniform distribution on an interval [a, b] has the property that all sub-intervals of the same length are equally likely.

Binomial distribution with normal approximation for n = 6 and p = 0.5 Binomial Distribution.svg
Binomial distribution with normal approximation for n = 6 and p = 0.5

Other examples of discrete univariate distributions include the binomial, geometric, negative binomial, and Poisson distributions. [1] At least 750 univariate discrete distributions have been reported in the literature. [2]

Examples of commonly applied continuous univariate distributions [3] include the normal distribution, Student's t distribution, chisquare distribution, F distribution, exponential and gamma distributions.

See also

Related Research Articles

<span class="mw-page-title-main">Probability distribution</span> Mathematical function for the probability a given outcome occurs in an experiment

In probability theory and statistics, a probability distribution is the mathematical function that gives the probabilities of occurrence of different possible outcomes for an experiment. It is a mathematical description of a random phenomenon in terms of its sample space and the probabilities of events.

<span class="mw-page-title-main">Random variable</span> Variable representing a random phenomenon

A random variable is a mathematical formalization of a quantity or object which depends on random events. The term 'random variable' can be misleading as its mathematical definition is not actually random nor a variable, but rather it is a function from possible outcomes in a sample space to a measurable space, often to the real numbers.

<span class="mw-page-title-main">Probability density function</span> Function whose integral over a region describes the probability of an event occurring in that region

In probability theory, a probability density function (PDF), density function, or density of an absolutely continuous random variable, is a function whose value at any given sample in the sample space can be interpreted as providing a relative likelihood that the value of the random variable would be equal to that sample. Probability density is the probability per unit length, in other words, while the absolute likelihood for a continuous random variable to take on any particular value is 0, the value of the PDF at two different samples can be used to infer, in any particular draw of the random variable, how much more likely it is that the random variable would be close to one sample compared to the other sample.

<span class="mw-page-title-main">Probability mass function</span> Discrete-variable probability distribution

In probability and statistics, a probability mass function is a function that gives the probability that a discrete random variable is exactly equal to some value. Sometimes it is also known as the discrete probability density function. The probability mass function is often the primary means of defining a discrete probability distribution, and such functions exist for either scalar or multivariate random variables whose domain is discrete.

In probability theory, the probability generating function of a discrete random variable is a power series representation (the generating function) of the probability mass function of the random variable. Probability generating functions are often employed for their succinct description of the sequence of probabilities Pr(X = i) in the probability mass function for a random variable X, and to make available the well-developed theory of power series with non-negative coefficients.

<span class="mw-page-title-main">Mathematical statistics</span> Branch of statistics

Mathematical statistics is the application of probability theory, a branch of mathematics, to statistics, as opposed to techniques for collecting statistical data. Specific mathematical techniques which are used for this include mathematical analysis, linear algebra, stochastic analysis, differential equations, and measure theory.

In probability theory, a compound Poisson distribution is the probability distribution of the sum of a number of independent identically-distributed random variables, where the number of terms to be added is itself a Poisson-distributed variable. The result can be either a continuous or a discrete distribution.

<span class="mw-page-title-main">Logarithmic distribution</span> Discrete probability distribution

In probability and statistics, the logarithmic distribution is a discrete probability distribution derived from the Maclaurin series expansion

<span class="mw-page-title-main">Discrete uniform distribution</span> Probability distribution on equally likely outcomes

In probability theory and statistics, the discrete uniform distribution is a symmetric probability distribution wherein a finite number of values are equally likely to be observed; every one of n values has equal probability 1/n. Another way of saying "discrete uniform distribution" would be "a known, finite number of outcomes equally likely to happen".

<span class="mw-page-title-main">Half-logistic distribution</span>

In probability theory and statistics, the half-logistic distribution is a continuous probability distribution—the distribution of the absolute value of a random variable following the logistic distribution. That is, for

<span class="mw-page-title-main">Truncated distribution</span>

In statistics, a truncated distribution is a conditional distribution that results from restricting the domain of some other probability distribution. Truncated distributions arise in practical statistics in cases where the ability to record, or even to know about, occurrences is limited to values which lie above or below a given threshold or within a specified range. For example, if the dates of birth of children in a school are examined, these would typically be subject to truncation relative to those of all children in the area given that the school accepts only children in a given age range on a specific date. There would be no information about how many children in the locality had dates of birth before or after the school's cutoff dates if only a direct approach to the school were used to obtain information.

A stochastic simulation is a simulation of a system that has variables that can change stochastically (randomly) with individual probabilities.

In probability theory, a probability distribution is infinitely divisible if it can be expressed as the probability distribution of the sum of an arbitrary number of independent and identically distributed (i.i.d.) random variables. The characteristic function of any infinitely divisible distribution is then called an infinitely divisible characteristic function.

<span class="mw-page-title-main">Poisson distribution</span> Discrete probability distribution

In probability theory and statistics, the Poisson distribution is a discrete probability distribution that expresses the probability of a given number of events occurring in a fixed interval of time if these events occur with a known constant mean rate and independently of the time since the last event. It can also be used for the number of events in other types of intervals than time, and in dimension greater than 1.

In probability and statistics, a compound probability distribution is the probability distribution that results from assuming that a random variable is distributed according to some parametrized distribution, with the parameters of that distribution themselves being random variables. If the parameter is a scale parameter, the resulting mixture is also called a scale mixture.

<span class="mw-page-title-main">Bates distribution</span> Propability distribution

In probability and business statistics, the Bates distribution, named after Grace Bates, is a probability distribution of the mean of a number of statistically independent uniformly distributed random variables on the unit interval. This distribution is related to the uniform, the triangular, and the normal Gaussian distribution, and has applications in broadcast engineering for signal enhancement. The Bates distribution is sometimes confused with the Irwin–Hall distribution, which is the distribution of the sum of n independent random variables uniformly distributed from 0 to 1.

<span class="mw-page-title-main">Delaporte distribution</span>

The Delaporte distribution is a discrete probability distribution that has received attention in actuarial science. It can be defined using the convolution of a negative binomial distribution with a Poisson distribution. Just as the negative binomial distribution can be viewed as a Poisson distribution where the mean parameter is itself a random variable with a gamma distribution, the Delaporte distribution can be viewed as a compound distribution based on a Poisson distribution, where there are two components to the mean parameter: a fixed component, which has the parameter, and a gamma-distributed variable component, which has the and parameters. The distribution is named for Pierre Delaporte, who analyzed it in relation to automobile accident claim counts in 1959, although it appeared in a different form as early as 1934 in a paper by Rolf von Lüders, where it was called the Formel II distribution.

In probability theory and statistics, the geometric Poisson distribution is used for describing objects that come in clusters, where the number of clusters follows a Poisson distribution and the number of objects within a cluster follows a geometric distribution. It is a particular case of the compound Poisson distribution.

Univariate is a term commonly used in statistics to describe a type of data which consists of observations on only a single characteristic or attribute. A simple example of univariate data would be the salaries of workers in industry. Like all the other data, univariate data can be visualized using graphs, images or other analysis tools after the data is measured, collected, reported, and analyzed.

References

  1. Johnson, N.L., Kemp, A.W., and Kotz, S. (2005) Discrete Univariate Distributions, 3rd Edition, Wiley, ISBN   978-0-471-27246-5.
  2. Wimmer G, Altmann G (1999) Thesaurus of univariate discrete probability distributions. STAMM Verlag GmbH Essen, 1st ed XXVII ISBN   3-87773-025-6
  3. Johnson N.L., Kotz S, Balakrishnan N. (1994) Continuous Univariate Distributions Vol 1. Wiley Series in Probability and Statistics.

Further reading