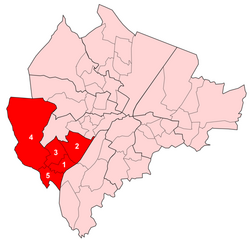
Upper Falls (District Electoral Area) Last updated June 04, 2025 Wards Map Ward Population (2011 Census) Catholic Protestant Other No Religion Area Density NI Assembly UK Parliament Ref 1 Andersonstown 4,907 94.5% 3.6% 0.3% 1.6% 1.08 km2 4,544/km2 Belfast West Belfast West [ 1] 2 Falls Park 5,343 94.4% 3.3% 0.7% 1.6% 2.35 km2 2,274/km2 Belfast West Belfast West [ 2] 3 Glen Road 5,573 95.1% 3.3% 0.5% 1.1% 1.57 km2 3,550/km2 Belfast West Belfast West [ 3] 4 Glencolin 6,498 93.2% 5.1% 0.2% 1.5% 9.54 km2 681/km2 Belfast West Belfast West [ 4] 5 Ladybrook 6,519 85.3% 10.9% 0.6% 3.1% 1.29 km2 5,053/km2 Belfast West Belfast West [ 5] Upper Falls 28,840 92.2% 5.5% 0.5% 1.8% 15.83 km2 1,822/km2 Belfast West Belfast West
2011 Election 2005: 4 x Sinn Féin, 1 x SDLP
2011: 4 x Sinn Féin, 1 x SDLP
2005-2011 Change: No change
Upper Falls - 5 seats [ 6] Party Candidate FPv% Count 1 2 3 Sinn Féin Matt Garrett 18.00% 2,250 Sinn Féin Gerard O'Neill *17.47% 2,184 Sinn Féin Emma Groves 17.07% 2,133 SDLP Tim Attwood *16.12% 2,015 2,356 Sinn Féin Caoimhín Mac Giolla Mhín 15.28% 1,910 1,952 2,009 éirígí Pádraic Mac Coitir 11.32% 1,415 1,428 1,474 SDLP Helen Walsh 2.00% 250 DUP Eileen Kingston 1.43% 179 Alliance Dan McGuinness 1.30% 162 Electorate: 20,530 Valid: 12,498 (60.88%) Spoilt: 298 Quota: 2,084 Turnout: 12,796 (62.33%)
2005 Election 2001: 4 x Sinn Féin, 1 x SDLP
2005: 4 x Sinn Féin, 1 x SDLP
2001-2005 Change: No change
Upper Falls - 5 seats [ 7] Party Candidate FPv% Count 1 2 3 4 Sinn Féin Paul Maskey *23.69% 3,084 SDLP Tim Attwood 21.63% 2,815 Sinn Féin Gerard O'Neill *18.81% 2,448 Sinn Féin Michael Browne *17.34% 2,257 Sinn Féin Christine Mac Giolla Mhín 10.97% 1,428 2,070.32 2,089.57 2,325.41 SDLP Roisin Mulholland 3.17% 413 467.56 1,025.56 1,031.83 Sinn Féin Caoimhín Mac Giolla Mhín 4.39% 571 779.54 843.44 863.79 Electorate: 19,767 Valid: 13,016 (65.85%) Spoilt: 437 Quota: 2,170 Turnout: 13,453 (68.06%)
2001 Election 1997: 4 x Sinn Féin, 1 x SDLP
2001: 4 x Sinn Féin, 1 x SDLP
1997-2001 Change: No change
Upper Falls - 5 seats [ 8] Party Candidate FPv% Count 1 2 3 4 Sinn Féin Paul Maskey 21.81% 3,349 SDLP Alex Attwood *21.23% 3,260 Sinn Féin Gerard O'Neill 18.66% 2,866 Sinn Féin Michael Browne *16.08% 2,469 2,548.68 2,628.26 Sinn Féin Chrissie McAuley *11.73% 1,801 2,442.52 2,494.96 2,592.96 SDLP Brian Heading 7.24% 1,112 1,131.44 1,569.13 1,774.13 NI Women's Coalition Mary Catney 2.38% 365 385.4 450.72 Alliance Mary Ayers 0.89% 136 137.92 183.69 Electorate: 22,107 Valid: 15,358 (69.47%) Spoilt: 614 Quota: 2,560 Turnout: 15,972 (72.25%)
1997 Election 1993: 3 x Sinn Féin, 2 x SDLP
1997: 4 x Sinn Féin, 1 x SDLP
1993-1997 Change: Sinn Féin gain from SDLP
Upper Falls - 5 seats [ 9] Party Candidate FPv% Count 1 2 3 4 SDLP Alex Attwood *20.42% 2,855 Sinn Féin Alex Maskey *20.08% 2,807 Sinn Féin Michael Browne 18.45% 2,580 Sinn Féin Martin Livingstone 17.12% 2,394 Sinn Féin Chrissie McAuley 12.43% 1,738 1,754.02 2,181.23 2,401.37 SDLP Patricia Lewsley * 4.26% 596 982.82 998.63 1,003.22 SDLP Stephen McGowan 4.41% 616 707.98 719.54 721.7 DUP David McNerlin 1.44% 201 201 201.17 201.26 Workers' Party James McAllister 0.79% 110 113.96 117.7 119.23 Alliance Dan McGuinness 0.61% 85 91.3 93.34 93.61 Electorate: 22,561 Valid: 13,982 (61.97%) Spoilt: 345 Quota: 2,331 Turnout: 14,327 (63.50%)
1993 Election 1989: 3 x Sinn Féin, 2 x SDLP
1993: 3 x Sinn Féin, 2 x SDLP
1989-1993 Change: No change
Upper Falls - 5 seats [ 10] Party Candidate FPv% Count 1 2 3 4 5 6 7 8 9 SDLP Alex Attwood *24.08% 3,203 Sinn Féin Una Gillespie 20.79% 2,765 Sinn Féin Alex Maskey *20.56% 2,735 Sinn Féin Mairtin O'Muilleoir *15.74% 2,093 2,114.12 2,629.32 SDLP Patricia Lewsley 6.00% 798 1,428.72 1,437.72 1,602.89 1,623.89 1,625.89 1,670.62 1,774.2 2,122.7 SDLP Terence Tracey 5.28% 702 888.24 891.64 1,007.84 1,019.24 1,027.24 1,059.73 1,167.52 1,327.21 Ind. Nationalist Cormac Boomer* 2.84% 378 474.96 477.56 582.14 594.34 595.34 626.15 744.45 Independent Labour Billy Lynn 1.08% 144 154.24 158.24 242.9 260.7 271.85 298.53 Alliance Julie Greaves 1.09% 145 173.8 175.4 186.19 187.39 253.59 266.7 Workers' Party James Maxwell 1.23% 164 171.36 173.56 206.76 208.36 217.36 DUP David McNerlin 1.31% 174 174.64 174.64 176.3 176.7 Electorate: 21,948 Valid: 13,301 (60.60%) Spoilt: 424 Quota: 2,217 Turnout: 13,725 (62.53%)
1989 Election 1985: 2 x Sinn Féin, 2 x SDLP, 1 x Alliance
1989: 3 x Sinn Féin, 2 x SDLP
1985-1989 Change: Sinn Féin gain from Alliance
Upper Falls - 5 seats [ 11] Party Candidate FPv% Count 1 2 3 4 5 6 7 SDLP Alex Attwood *26.53% 3,292 Sinn Féin Alex Maskey *19.26% 2,378 Sinn Féin Teresa Holland *18.77% 2,329 SDLP Cormac Boomer *9.58% 1,189 2,202.46 Sinn Féin Mairtin O'Muilleoir 15.74% 1,435 1,462.74 1,739.64 1,976.47 2,000.75 2,004.3 2,004.67 SDLP Peter Prendiville 5.75% 713 815.98 819.1 820.97 834.35 935.6 962.75 Alliance Dan McGuinness 2.63% 326 363.24 365.71 368.35 374.73 384.88 505.88 Workers' Party Jean Craig 3.06% 380 409.64 411.72 413.48 432.48 443.83 488.83 DUP Robert Morrow 2.28% 283 283 283.39 283.72 283.72 283.97 Communist Kevin O'Donnell 0.68% 84 87.04 89.77 90.54 Electorate: 22,975 Valid: 12,409 (54.01%) Spoilt: 426 Quota: 2,069 Turnout: 12,835 (55.87%)
1985 Election 1985: 2 x Sinn Féin, 2 x SDLP, 1 x Alliance
Upper Falls - 5 seats [ 12] Party Candidate FPv% Count 1 2 3 4 5 6 7 8 9 SDLP Alex Attwood 19.35% 2,461 Sinn Féin Alex Maskey 18.30% 2,329 Sinn Féin Teresa Holland 17.73% 2,256 SDLP Cormac Boomer *13.01% 1,655 1,890.43 1,897.72 1,900.42 1,903.42 1,958.24 2,028.22 2,161.22 Alliance Pip Glendinning 7.32% 931 947.38 949.9 951.16 955.16 958.73 994.31 1,334.43 1,805.43 Sinn Féin Mairtin O'Muilleoir 8.01% 1,031 1,034.25 1,214.16 1,334.58 1,339.82 1,410.1 1,440.06 1,461.64 1,561.64 SDLP Mary Muldoon* 6.28% 799 834.36 840.84 843.36 850.36 903.78 940.23 1,035.15 Workers' Party Gerald McCann 3.03% 386 389.77 390.67 391.63 405.76 413.51 463.37 DUP Irene Lewis 2.92% 372 372.39 372.39 372.51 372.6 372.6 374.6 Labour and Trade Union Michael Duffy 1.87% 238 243.2 244.82 246.14 255.14 273.81 People's Democracy John McAnulty* 1.03% 131 131.91 137.67 140.73 146 SDLP Peter Prendiville 0.57% 72 87.86 88.04 88.28 90.5 Communist Kevin McCorry 0.47% 60 60.39 61.11 61.17 Electorate: 23,327 Valid: 12,721 (54.53%) Spoilt: 331 Quota: 2,121 Turnout: 13,052 (55.95%)
References
Places adjacent to Upper Falls (District Electoral Area)
This page is based on this
Wikipedia article Text is available under the
CC BY-SA 4.0 license; additional terms may apply.
Images, videos and audio are available under their respective licenses.