List of countries by oil imports

Last updated

Trends in the top five crude oil-importing countries, 1960-2012 Top 5 Importers of Petroleum.png
Trends in the top five crude oil-importing countries, 1960–2012

This is a list of countries by oil imports based on The World Factbook ^ and other sources. [1] Many countries also export oil, and some export more oil than they import.

Crude Oil Import by Country [2]
Country/RegionCrude Oil - Imports
(bbl/day - est.)
Year of
Information
Flag of Europe.svg  European Union 14,060,0002017
Flag of the People's Republic of China.svg  China 10,852,6152020 [3]
Flag of the United States.svg  United States 5,877,0002020
Flag of India.svg  India 4,033,0502020 [4]
Flag of Japan.svg  Japan 2,472,3642020
Flag of South Korea.svg  South Korea 2,660,3692020
Flag of Germany.svg  Germany 1,671,1782020
Flag of the Philippines.svg  Philippines 89,3002020
Flag of Italy.svg  Italy 1,014,2412020
Flag of Spain.svg  Spain 1,104,5942020
Flag of the United Kingdom.svg  United Kingdom 708,7082020
Flag of the Netherlands.svg  Netherlands 997,7692020
Flag of France.svg  France 666,1802020
Flag of Singapore.svg  Singapore 752,9172020
Flag of Thailand.svg  Thailand 837,3332020
Flag of the Republic of China.svg  Taiwan 841,3002015
Flag of Canada (Pantone).svg  Canada 718,3742020
Flag of Belgium (civil).svg  Belgium 550,9182020
Flag of Greece.svg  Greece 458,5312020
Flag of Poland.svg  Poland 538,9072019
Flag of Australia (converted).svg  Australia 231,9342020
Flag of Belarus.svg  Belarus 433,4002012
Flag of South Africa.svg  South Africa 451,6672019
Flag of Indonesia.svg  Indonesia 233,0002020
Flag of Turkey.svg  Turkey 379,6002013
Flag of Pakistan.svg  Pakistan 372,8002013
Flag of Sweden.svg  Sweden 352,3002013
Flag of Brazil.svg  Brazil 344,9002012
Flag of Portugal.svg  Portugal 282,4002013
Flag of Israel.svg  Israel 275,6002013
Flag of Bahrain.svg  Bahrain 243,3002012
Flag of Finland.svg  Finland 236,0002013
Flag of Aruba.svg  Aruba 229,0002012
Flag of Malaysia.svg  Malaysia 200,2002012
Flag of Chile.svg  Chile 186,9002013
Flag of Lithuania.svg  Lithuania 181,9002012
Flag of Austria.svg  Austria 173,9002014
Flag of Cuba.svg  Cuba 160,0002013
Flag of Morocco.svg  Morocco 148,5002012
Flag of the Czech Republic.svg  Czech Republic 131,3002013
Flag of Bulgaria.svg  Bulgaria 128,1002012
Flag of Kazakhstan.svg  Kazakhstan 118,4002012
Flag of Slovakia.svg  Slovakia 117,6002013
Flag of Hungary.svg  Hungary 115,3002013
Flag of Peru.svg  Peru 110,6002012
Flag of Romania.svg  Romania 104,9002012
Flag of Switzerland (Pantone).svg  Switzerland 101,4002013
Flag of New Zealand.svg  New Zealand 101,2002013
Flag of Denmark.svg  Denmark 99,6902013
Flag of Egypt.svg  Egypt 80,0002013
Flag of Cote d'Ivoire.svg  Côte d'Ivoire 72,8602012
Flag of North Korea.svg  North Korea 70,0002013
Flag of Ireland.svg  Ireland 66,4902013
Flag of Jordan.svg  Jordan 59,4402013
Flag of Trinidad and Tobago.svg  Trinidad and Tobago 59,1802012
Flag of Indonesia.svg  Indonesia 53,7002012
Flag of Uruguay.svg  Uruguay 40,8802012
Flag of Croatia.svg  Croatia 37,3002014
Flag of Norway.svg  Norway 37,0802013
Flag of Ukraine.svg  Ukraine 33,0202012
Flag of Sri Lanka.svg  Sri Lanka 32,5202012
Flag of Cameroon.svg  Cameroon 31,9602012
Flag of Serbia.svg  Serbia 31,7302014
Flag of Russia.svg  Russia 29,6502014
Flag of Iran.svg  Iran 28,1402012
Flag of the Dominican Republic.svg  Dominican Republic 26,5002012
Flag of Bangladesh.svg  Bangladesh 25,3202012
Flag of Ghana.svg  Ghana 24,2002012
Flag of Jamaica.svg  Jamaica 24,1602012
Flag of Tunisia.svg  Tunisia 22,1202012
Flag of Bosnia and Herzegovina.svg  Bosnia and Herzegovina 20,0402012
Flag of Kenya.svg  Kenya 19,8302012
Flag of Senegal.svg  Senegal 15,5602012
Flag of Papua New Guinea.svg  Papua New Guinea 14,8802012
Flag of Zambia.svg  Zambia 14,3402012
Flag of Nicaragua.svg  Nicaragua 13,5802014
Flag of El Salvador.svg  El Salvador 9,9402012
Flag of Mexico.svg  Mexico 9,8842013
Flag of Algeria.svg  Algeria 5,9002012
Flag of the United States Virgin Islands.svg  U.S. Virgin Islands 4,4932012
Flag of Albania.svg  Albania 3,4402012
Flag of Uzbekistan.svg  Uzbekistan 3402012
Flag of North Macedonia.svg  Macedonia 1462014
Flag of Latvia.svg  Latvia 1402012
Flag of Argentina.svg  Argentina 1002012
Flag of Myanmar.svg  Myanmar 402012

See also

Related Research Articles

<span class="mw-page-title-main">Economy of Burundi</span> Economy of the country

The economy of Burundi is $3.436 billion by gross domestic product as of 2018, being heavily dependent on agriculture, which accounts for 32.9% of gross domestic product as of 2008. Burundi itself is a landlocked country lacking resources, and with almost nonexistent industrialization. Agriculture supports more than 70% of the labor force, the majority of whom are subsistence farmers.

<span class="mw-page-title-main">Economy of Chad</span> National economy

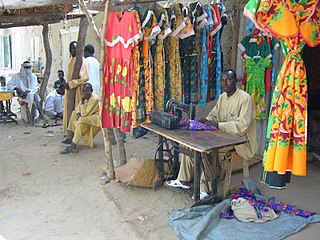
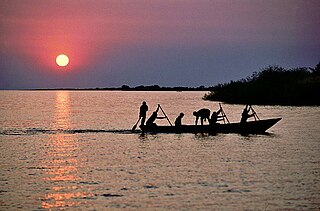
The economy of Chad suffers from the landlocked country's geographic remoteness, drought, lack of infrastructure, and political turmoil. About 85% of the population depends on agriculture, including the herding of livestock. Of Africa's Francophone countries, Chad benefited least from the 50% devaluation of their currencies in January 1994. Financial aid from the World Bank, the African Development Bank, and other sources is directed largely at the improvement of agriculture, especially livestock production. Because of lack of financing, the development of oil fields near Doba, originally due to finish in 2000, was delayed until 2003. It was finally developed and is now operated by ExxonMobil. In terms of gross domestic product, Chad ranks 143rd globally with $11.051 billion dollars as of 2018.

<span class="mw-page-title-main">Economy of Gabon</span>

The economy of Gabon is characterized by strong links with France, large foreign investments, dependence on skilled foreign labor, and decline of agriculture. Gabon enjoys a per capita income four times that of most nations of sub-Saharan Africa, its reliance on resource extraction industry releasing much of the population from extreme poverty.

<span class="mw-page-title-main">Economy of Mauritania</span>

The economy of Mauritania is still largely based on agriculture and livestock, even though most of the nomads and many subsistence farmers were forced into the cities by recurring droughts in the 1970s and 1980s.

<span class="mw-page-title-main">Economy of Russia</span> National economy of Russia

The economy of Russia has gradually transformed from a planned economy into a mixed market-oriented economy. It has enormous natural resources, particularly oil and natural gas. It is the world's ninth-largest economy by nominal GDP, and the sixth-largest by PPP. Russia's membership to the WTO was accepted in 2011.

<span class="mw-page-title-main">Economy of Sierra Leone</span> National economy

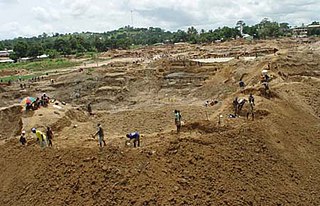
The economy of Sierra Leone is $4.082 billion by gross domestic product as of 2018. Since the end of the Sierra Leone Civil War in 2002, the economy is gradually recovering with a gross domestic product growth rate between 4 and 7%. In 2008 it in PPP ranked between 147th by World Bank, and 153rd by CIA, largest in the world.

<span class="mw-page-title-main">Economy of Mozambique</span> National economy

The economy of Mozambique is $14.396 billion by gross domestic product as of 2018, and has developed since the end of the Mozambican Civil War (1977–1992). In 1987, the government embarked on a series of macroeconomic reforms, which were designed to stabilize the economy. These steps, combined with donor assistance and with political stability since the multi-party elections in 1994, have led to dramatic improvements in the country's growth rate. Inflation was brought to single digits during the late 1990s, although it returned to double digits in 2000–02. Fiscal reforms, including the introduction of a value-added tax and reform of the customs service, have improved the government's revenue collection abilities.

<span class="mw-page-title-main">Energy in Iran</span> Overview of the production, consumption, import and export of energy and electricity in Iran

Iran has the fourth largest oil reserves and the 2nd largest natural gas reserves in the world. The nation is a member of OPEC, and generates approximately 50% of state revenue through oil exports.

<span class="mw-page-title-main">Economy of Ivory Coast</span> National economy

The economy of Ivory Coast is stable and currently growing, in the aftermath of political instability in recent decades. The Ivory Coast's economy is largely market-based and depends heavily on the agricultural sector. Almost 70% of the Ivorian people are engaged in some form of agricultural activity. GDP per capita grew 82% in the 1960s, reaching a peak growth of 360% in the 1970s, but this proved unsustainable and it shrank by 28% in the 1980s and a further 22% in the 1990s. This decline, coupled with high population growth, resulted in a steady fall in living standards. The Gross national product per capita, now rising again, was about US$727 in 1996. It was substantially higher two decades before.

The following are international rankings of Saudi Arabia.

<span class="mw-page-title-main">Energy in Qatar</span>

Energy in Qatar describes energy production, consumption, and policies of the State of Qatar. The International Monetary Fund ranked Qatar as having the fifth highest GDP per capita in 2016 with a 60,787 USD per capita nominal GDP over a population of 2.421 million inhabitants. In 2014, oil and natural gas production made up 51.1% of Qatar's nominal GDP. Thus, Qatar has a worldwide high ranking of per capita GDP due to its significance production and exports in both crude oil and natural gas in proportion to its relatively small population.

<span class="mw-page-title-main">Foreign trade of South Africa</span>

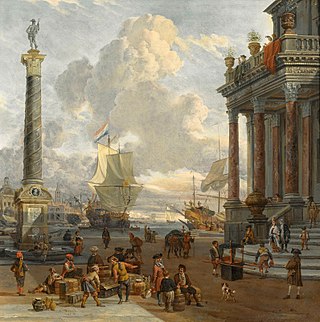
Since the end of apartheid, foreign trade in South Africa has increased, following the lifting of several sanctions and boycotts which were imposed as a means of ending apartheid.

References

  1. "International - U.S. Energy Information Administration (EIA)".
  2. "The World Factbook". report. Central Intelligence Agency. Archived from the original on June 16, 2013. Retrieved 12 September 2016.
  3. "China becomes world's largest oil importer". www.ecns.cn. Retrieved 2018-02-07.
  4. "India's oil imports hit record high in January". The Economic Times. 2018-02-15. Retrieved 2018-02-16.