List of countries by proven oil reserves

Last updated

Map of countries with proven oil reserves - according to U.S. EIA (start of 2017) Map-of-countries-by-proven-oil-reserves-(in-millions-of-barrels)---2017---US-EIA---Jo-Di-graphics.jpg
Map of countries with proven oil reserves - according to U.S. EIA (start of 2017)
Trends in proven oil reserves in top five countries, 1980-2013 (data from US Energy Information Administration) Oil Reserves Top 5 Countries.png
Trends in proven oil reserves in top five countries, 1980–2013 (data from US Energy Information Administration)
A map of world oil reserves according to OPEC, January 2014 Oil Reserves Updated.png
A map of world oil reserves according to OPEC, January 2014

Proven oil reserves are those quantities of petroleum which, by analysis of geological and engineering data, can be estimated, with a high degree of confidence, to be commercially recoverable from a given date forward from known reservoirs and under current economic conditions.

Contents

Some statistics on this page are disputed and controversial—different sources (OPEC, CIA World Factbook , oil companies) give different figures. Some of the differences reflect different types of oil included. Different estimates may or may not include oil shale, mined oil sands or natural gas liquids.

Because proven reserves include oil recoverable under current economic conditions, nations may see large increases in proven reserves when known, but previously uneconomic deposits become economic to develop. In this way, Canada's proven reserves increased suddenly in 2003 when the oil sands of Alberta were seen to be economically viable. Similarly, Venezuela's proven reserves jumped in the late 2000s when the heavy oil of the Orinoco Belt was judged economic.

Sources

Sources sometimes differ on the volume of proven oil reserves. The differences sometimes result from different classes of oil included, and sometimes result from different definitions of proven. (The data below does not seem to include shale oil and other "unconventional" sources of oil such as tar sands. For instance, North America has over 3 trillion barrels of shale oil reserves,[ citation needed ] and the majority of oil produced in the USA is from shale, leading to the paradoxical data below that the USA will finish all its oil at current production in 11 years, because the production is mostly from shale but the reserves cited omit all shale reserves.)

Comparison of proven oil reserves from some widely used sources (billions of barrels, as of 31 Dec 2014)

SourceCanadaIranIraqRussiaSaudi ArabiaUnited StatesVenezuela
BP [1] 172.9157.8143103.2267.048.5298.3
OPEC [2] 4.2157.5147.280.0266.636.5300.0
US CIA [3] 171.0157.8147103.2268.336.5298.4
US EIA [4] 172.5157.814580.0268.339.9298.4

Countries

Reserves amounts are listed in millions of barrels.

Proven reserves (millions of barrels)
Country US EIA
[5]
OPEC
[6]
BP
[7]
OthersOil production
2021 (bbl/day) [8]
Years of
production
in reserve
Flag of Venezuela.svg Venezuela *(OPEC)304,000302,809300,900700,0001,000
Flag of Saudi Arabia.svg Saudi Arabia *(OPEC)259,000266,260266,00010,846,00065.4
Flag of Iran.svg Iran *(OPEC)209,000 [9] 208,600155,6003,511,000163
Flag of Canada (Pantone).svg Canada * 170,0004,421172,200 [10] 171,0005,663,00082
Flag of Iraq.svg Iraq *(OPEC)145,000147,223143,1004,188,00094.8
Flag of Kuwait.svg Kuwait *(OPEC)102,000104,000104,0002,715,000103
Flag of the United Arab Emirates.svg United Arab Emirates *(OPEC)98,000111,000111,0003,638,00074
Flag of Russia.svg Russia * 80,00080,000102,4009,990,00020
Flag of Libya.svg Libya *(OPEC)48,00074,36378,4001,224,000110
Flag of the United States.svg United States * 48,300 [11] 32,77355,000 [12] 43,62911,315,0006.3
Flag of Nigeria.svg Nigeria *(OPEC)37,00037,45337,1001,684,00060
Flag of Kazakhstan.svg Kazakhstan * 30,00030,00030,0001,849,00040
Flag of the People's Republic of China.svg China * 26,00025,62718,5004,341,00016
Flag of Qatar.svg Qatar * 25,00025,24425,2441,808,00038
Flag of Namibia.svg Namibia * 13,00012,63413,000 [12] 16,8483,054,00012
Flag of Algeria.svg Algeria *(OPEC)12,00012,20012,2001,363,00024
Flag of Guyana.svg Guyana * 11,000 [13] 117,000200
Flag of Brazil.svg Brazil * 11,000 [14] [15]
Flag of Ecuador.svg Ecuador 8,3008,2738,000475,00048
Flag of Norway.svg Norway * 8,1006,3768,0002,056,00011
Flag of Angola.svg Angola *(OPEC)7,8008,38412,7001,162,00018
Flag of Azerbaijan.svg Azerbaijan * 7,0007,0007,000709,00030
Flag of Suriname.svg Suriname 6,500 [16] 14,0001,300
Flag of Mexico.svg Mexico * 5,8006,53710,800 [17] 9.7001,972,0008.1
Flag of Oman.svg Oman * 5,4005,3735,300980,00015
Flag of India.svg India * 4,6004,4955,680 [12] 4,409886,00014
Flag of Vietnam.svg Vietnam * 4,4004,4004,000203,00059
Flag of South Sudan.svg South Sudan 3,800153,00068
Flag of Malaysia.svg Malaysia * 3,6003,6003,600 [12] 5,542517,00019
Flag of Egypt.svg Egypt * 3,3004,4003,500592,00015
Flag of Yemen.svg Yemen * 3,0003,00059,000100
Flag of the Republic of the Congo.svg Congo(OPEC)2,9001,600275,00029
Flag of the United Kingdom.svg United Kingdom * 2,5002,0692,8002,618928,0007.4
Flag of Syria.svg Syria * 2,5002,5002,50042,000160
Flag of Uganda.svg Uganda * 2,500
Flag of Argentina.svg Argentina * 2,5002,1622,400 [18] 16,000701,0009.8
Flag of Indonesia.svg Indonesia * 2,5003,3103,6003,497858,0008.0
Flag of Australia (converted).svg Australia * 2,4003,9854,0004,002253,00026
Flag of Colombia.svg Colombia * 2,0001,6652,300768,0007
Flag of Gabon.svg Gabon *(OPEC)2,0002,0002,000181,00030
Flag of Chad.svg Chad * 1,5001,50096,00043
Flag of Turkey.svg Turkey * 1,4001350120,00010
Flag of Sudan.svg Sudan * 1,3005,0001,50063,00056
Flag of Brunei.svg Brunei * 1,1001,1001,10093,00032
Flag of Equatorial Guinea.svg Equatorial Guinea *(OPEC)1,1001,100144,00021
Flag of Peru.svg Peru * 9001,400 [12] 1,489126,00020
Flag of Kenya.svg Kenya * 750
Flag of Ghana.svg Ghana * 700160,00010
Flag of Romania.svg Romania * 60060084,00020
Flag of Turkmenistan.svg Turkmenistan * 600600600224,0007
Flag of Uzbekistan.svg Uzbekistan * 60059460037,00040
Flag of Pakistan.svg Pakistan * 500 [12] 236105,00010
Flag of Italy.svg Italy * 500600 [12] 595146,0009
Flag of Denmark.svg Denmark * 400439600 [12] 55071,00020
Flag of Tunisia.svg Tunisia * 40040037,00030
Flag of Ukraine.svg Ukraine * 40039562,00020
Flag of Thailand.svg Thailand * 300400461,0002
Flag of Trinidad and Tobago.svg Trinidad and Tobago * 200700 [12] 83082,0007
Bandera de Bolivia (Estado).svg Bolivia * 200 [12] 21065,0008
Flag of Cameroon.svg Cameroon * 20068,0008
Flag of Belarus.svg Belarus * 20019834,00020
Flag of Bahrain.svg Bahrain * 200189,0003
Flag of the Democratic Republic of the Congo.svg DR Congo 20021,00030
Flag of Papua New Guinea.svg Papua New Guinea * 200 [12] 15837,00010
Flag of Albania.svg Albania * 20016,00030
Flag of Chile.svg Chile * 20016,00030
Flag of Niger.svg Niger * 20013,00040
Flag of Spain.svg Spain * 20077,0007
Flag of Myanmar.svg Myanmar * 1008,20030
Flag of the Philippines.svg Philippines 10015,00020
Flag of the Netherlands.svg Netherlands 100 [12] 14174,0004
Flag of Cuba.svg Cuba * 100 [12] 12437,0007
Flag of Germany.svg Germany * 100 [12] 229116,0002
Flag of Poland.svg Poland * 100 [12] 15137,0007
Flag of Cote d'Ivoire.svg Ivory Coast * 10029,0009
Flag of Somalia.svg Somalia * 111,000 [19]
Flag of Guatemala.svg Guatemala 8612,00020
Flag of Serbia.svg Serbia * 7717,00012
Flag of Croatia.svg Croatia * 7116,00012
Flag of France.svg France * 6161,0002.7
Flag of Japan.svg Japan * 44104,0001.2
Flag of New Zealand.svg New Zealand * 4021,0005
Flag of Kyrgyzstan (2023).svg Kyrgyzstan * 40700200
Flag of Austria.svg Austria * 3525,0003.8
Flag of Georgia.svg Georgia * 35300300
Flag of Bangladesh.svg Bangladesh * 2813,0005.9
Flag of Mauritania.svg Mauritania * 20
Flag of Bulgaria.svg Bulgaria * 156,1006.7
Flag of the Czech Republic.svg Czech Republic * 1515.010,0004
Flag of South Africa.svg South Africa * 1515105,0000.39
Flag of Israel.svg Israel * 12 [12] 125,8005.7
Flag of Hungary.svg Hungary * 12 [12] 3539,0000.84
Flag of Lithuania.svg Lithuania * 128,9003.7
Flag of Tajikistan.svg Tajikistan * 12300100
Flag of Greece.svg Greece * 1015,0002
Flag of Slovakia.svg Slovakia * 96,4004
Flag of Benin.svg Benin * 8
Flag of Belize.svg Belize * 61,70010
Flag of the Republic of China.svg Taiwan * 225,0000.2
Flag of Barbados.svg Barbados 15005
Flag of Jordan.svg Jordan * 1 [12] 13009
Flag of Morocco.svg Morocco * 0.616010
Flag of Ethiopia.svg Ethiopia * 0.4
 World1,703,0001,535,7731,750,60093,148,00050.06

* indicates "Oil reserves in COUNTRY or TERRITORY" or "Energy in COUNTRY or TERRITORY" links.

See also

Related Research Articles

<span class="mw-page-title-main">Petroleum</span> Naturally occurring flammable liquid

Petroleum, also known as crude oil or simply oil, is a naturally occurring yellowish-black liquid mixture of mainly hydrocarbons, and is found in geological formations. The name petroleum covers both naturally occurring unprocessed crude oil and petroleum products that consist of refined crude oil.

<span class="mw-page-title-main">OPEC</span> Intergovernmental oil organization

The Organization of the Petroleum Exporting Countries is an organization enabling the co-operation of leading oil-producing countries in order to collectively influence the global oil market and maximize profit. It was founded on 14 September 1960 in Baghdad by the first five members. The organization, which currently comprises 12 member countries, accounted for an estimated 30 percent of global oil production. A 2022 report further details that OPEC member countries were responsible for approximately 38 percent of it. Additionally, it is estimated that 79.5 percent of the world's proven oil reserves are located within OPEC nations, with the Middle East alone accounting for 67.2 percent of OPEC's total reserves.

<span class="mw-page-title-main">Peak oil</span> Point in time when the maximum rate of petroleum extraction is reached

Peak oil is the theorized point in time when the maximum rate of global oil production will occur, after which oil production will begin an irreversible decline. The primary concern of peak oil is that global transportation heavily relies upon the use of gasoline and diesel fuel. Switching transportation to electric vehicles, biofuels, or more fuel-efficient forms of travel may help reduce oil demand.

<span class="mw-page-title-main">Petroleum politics</span>

Petroleum politics have been an increasingly important aspect of diplomacy since the rise of the petroleum industry in the Middle East in the early 20th century. As competition continues for a vital resource, the strategic calculations of major and minor countries alike place prominent emphasis on the pumping, refining, transport, sale and use of petroleum products.

<span class="mw-page-title-main">Price of oil</span> Spot price of a barrel of benchmark crude oil

The price of oil, or the oil price, generally refers to the spot price of a barrel of benchmark crude oil—a reference price for buyers and sellers of crude oil such as West Texas Intermediate (WTI), Brent Crude, Dubai Crude, OPEC Reference Basket, Tapis crude, Bonny Light, Urals oil, Isthmus, and Western Canadian Select (WCS). Oil prices are determined by global supply and demand, rather than any country's domestic production level.

<span class="mw-page-title-main">United States energy independence</span> Idea of eliminating the need for the United States to import foreign sources of energy

United States energy independence is the concept of eliminating or substantially reducing import of petroleum to satisfy the nation's need for energy. Some proposals for achieving energy independence would permit imports from the neighboring nations of Canada and Mexico, in which case it would be called North American energy independence. Energy independence is espoused by those who want to leave the US unaffected by global energy supply disruptions and would restrict reliance upon politically unstable states for its energy security.

<span class="mw-page-title-main">Energy in Iran</span> Overview of the production, consumption, import and export of energy and electricity in Iran

Iran possesses significant energy reserves, holding the position of the world's third-largest in proved oil reserves and the second-largest in natural gas reserves as of 2021. At the conclusion of the same year, Iran's share comprised 24% of the oil reserves in the Middle East and 12% of the worldwide total.

<span class="mw-page-title-main">Predicting the timing of peak oil</span>

Peak oil is the point at which oil production, sometimes including unconventional oil sources, hits its maximum. Predicting the timing of peak oil involves estimation of future production from existing oil fields as well as future discoveries. The most influential production model is Hubbert peak theory, first proposed in the 1950s. The effect of peak oil on the world economy remains controversial.

<span class="mw-page-title-main">Petroleum in the United States</span>

Petroleum has been a major industry in the United States since the 1859 Pennsylvania oil rush around Titusville, Pennsylvania. Commonly characterized as "Big Oil", the industry includes exploration, production, refining, transportation, and marketing of oil and natural gas products. The leading crude oil-producing areas in the United States in 2023 were Texas, followed by the offshore federal zone of the Gulf of Mexico, North Dakota and New Mexico.

<span class="mw-page-title-main">Oil reserves in Saudi Arabia</span> Oil reserves located in Saudi Arabia

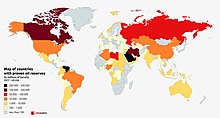
The proven oil reserves in Saudi Arabia are reportedly the second largest in the world, estimated in 2017 to be 268 billion barrels, including 2.5 Gbbl in the Saudi–Kuwaiti neutral zone. This would correspond to more than 50 years of production at current rates. In the oil industry, an oil barrel is defined as 42 US gallons, which is about 159 litres, or 35 imperial gallons. The oil reserves are predominantly found in the Eastern Province. These reserves were apparently the largest in the world until Venezuela announced they had increased their proven reserves to 297 Gbbl in January 2011. The Saudi reserves are about one-fifth of the world's total conventional oil reserves. A large fraction of these reserves comes from a small number of very large oil fields, and past production amounts to 40% of the stated reserves. Other sources state that Saudi Arabia has about 297.7 billion barrels.

<span class="mw-page-title-main">Oil reserves in Canada</span>

Oil reserves in Canada were estimated at 172 billion barrels as of the start of 2015 . This figure includes the oil sands reserves that are estimated by government regulators to be economically producible at current prices using current technology. According to this figure, Canada's reserves are third only to Venezuela and Saudi Arabia. Over 95% of these reserves are in the oil sands deposits in the province of Alberta. Alberta contains nearly all of Canada's oil sands and much of its conventional oil reserves. The balance is concentrated in several other provinces and territories. Saskatchewan and offshore areas of Newfoundland in particular have substantial oil production and reserves. Alberta has 39% of Canada's remaining conventional oil reserves, offshore Newfoundland 28% and Saskatchewan 27%, but if oil sands are included, Alberta's share is over 98%.

<span class="mw-page-title-main">Oil reserves in Venezuela</span> Oil reserves located in Venezuela

The proven oil reserves in Venezuela are recognized as the largest in the world, totaling 300 billion barrels (4.8×10¹⁰ m3) as of 1 January 2014. The 2019 edition of the BP Statistical Review of World Energy reports the total proved reserves of 303.3 billion barrels for Venezuela (slightly more than Saudi Arabia's 297.7 billion barrels).

There have been widely varying estimates of proven oil reserves in Russia. Most estimates included only Western Siberian reserves, which have been exploited since the 1970s and supply two-thirds of Russian oil. However, there are potentially huge reserves elsewhere. In 2005, the Russian Ministry of Natural Resources estimated that another 4.7 billion barrels of oil exist in Eastern Siberia. In July 2013, the Russian Natural Resources Ministry made official estimates of reserves available for the first time. According to Russian Natural Resources Minister Sergey Donskoy, as of 1 January 2012, recoverable reserves of oil in Russia under category ABC1 were 17.8 billion tons and category C2 reserves were 10.9 billion tons.

<span class="mw-page-title-main">Oil reserves in the United States</span> Oil reserves located in the United States

Within the petroleum industry, proven crude oil reserves in the United States were 44.4 billion barrels (7.06×10⁹ m3) of crude oil as of the end of 2021, excluding the Strategic Petroleum Reserve.

<span class="mw-page-title-main">Energy in Egypt</span>

This article describes the energy and electricity production, consumption and import in Egypt.

Energy in Iraq plays a crucial role in both the national economy and the global energy markets due to the country's vast oil reserves and significant status within the Organization of the Petroleum Exporting Countries (OPEC).

Oil and Gas dominates the resource sector of the Republic of the Congo, also referred to as Congo-Brazzaville, with the petroleum industry accounting for 89% of the country's exports in 2010. As of June 22, 2018 is a full member of the organisation of the petroleum exporting countries (OPEC), and among African crude oil producers in 2022, The Congo ranked sixth. Nearly all of the country's hydrocarbons were produced off-shore.

References

  1. BP Statistical Review of World Energy, 2015
  2. OPEC Statistical Bulletin, 2015.
  3. World Factbook, US Central Intelligence Agency, 2015.
  4. "U.S. Crude Oil plus Lease Condensate Proved Reserves". www.eia.gov. Retrieved 13 June 2021.
  5. "International - U.S. Energy Information Administration (EIA)". www.eia.gov. Retrieved 5 October 2023.
  6. Economou, Andreas; Fattouh, Bassam (7 May 2021). "OPEC at 60: the world with and without OPEC". OPEC Energy Review. 45 (1): 3–28. Bibcode:2021OEnRv..45....3E. doi: 10.1111/opec.12205 . ISSN   1753-0229.
  7. "Statistical Review of World Energy" (PDF). www.bp.com. 8 June 2016. Retrieved 23 October 2023.
  8. "International - U.S. Energy Information Administration (EIA)". www.eia.gov. Retrieved 5 October 2023.
  9. "OPEC : Iran". www.opec.org. Retrieved 13 June 2021.
  10. Oil Resources, Natural Resources Canada, 16 Feb. 2,016.
  11. "U.S. Crude Oil and Natural Gas Proved Reserves, Year-end 2022".April 29, 2024
  12. 1 2 3 4 5 6 7 8 9 10 11 12 13 14 15 16 17 18 Reolon, Dario; Di Maggio, Federica; Moriggi, Sara; Galli, Giuseppe; Pirrone, Marco (24 June 2020). "Unlocking Data Analytics for the Automatic Evaluation of Cement Bond Scenarios". SPWLA 61st Annual Online Symposium Transactions. Society of Petrophysicists and Well Log Analysts. doi:10.30632/spwla-5060. S2CID   225718759.
  13. "Guyana scrambles to make the most of oil wealth". BBC News . Retrieved 3 December 2023.
  14. pedromedro (6 July 2011). "Namibia Sees 11 Billion Barrels In Offshore Oil Reserves". Eco (Atlantic) Oil & Gas Plc. Retrieved 21 December 2023.
  15. "Namibia's offshore oil discoveries estimated at 11 bln barrels - NAMCOR". Reuters.
  16. OilNOW (5 August 2020). "Suriname's Block 58 could hold 6.5 billion barrels of oil – Morgan Stanley | OilNOW" . Retrieved 26 September 2023.
  17. "Request Rejected". www.pemex.com. Retrieved 13 June 2021.
  18. [https://oilprice.com/Energy/Crude-Oil/Argentinas-Oil-Industry-Is-Finally-Bouncing-Back.html
  19. "British Oil Firm Accused of Corruption in Somalia Exploration Deal". VOA . Retrieved 3 December 2023.