List of countries by natural gas production

Last updated

Countries by natural gas proven reserves (2014), based on data from The World Factbook Countries by Natural Gas Proven Reserves (2014).svg
Countries by natural gas proven reserves (2014), based on data from The World Factbook
Natural gas production by region Natural gas production by region, OWID.svg
Natural gas production by region

This is a list of countries by natural gas production based on statistics from The U.S Energy Information Administration (EIA).

Contents

Natural Gas in this list means dry natural gas; which is used in homes and business for heating, cooling, cooking and electricity generation, it can also be compressed and used as a fuel. [1]

Dry natural gas in mainly composed of methane. In contrast, wet natural gas also contains significant portions of other liquids such as ethane, propane or butane (also known as Natural Gas Liquids). Wet natural gas is used for petrochemicals as well as gasoline (petrol).

In 2022, the United States has led the world in both natural gas production and natural gas exports.

Countries by rank

CountryContinentNatural Gas Production
2022 (million m3) [2]
Flag of the United States.svg  United States North America 1,029,000
Flag of Russia.svg  Russia Europe/Asia 618,000
Flag of Iran.svg  Iran Asia 263,000
Flag of the People's Republic of China.svg  China Asia 225,000
Flag of Canada (Pantone).svg  Canada North America 188,000
Flag of Qatar.svg  Qatar Asia 170,000
Flag of Australia (converted).svg  Australia Oceania 154,000
Flag of Saudi Arabia.svg  Saudi Arabia Asia 122,000
Flag of Norway.svg  Norway Europe 124,000
Flag of Algeria.svg  Algeria Africa 101,000
Flag of Turkmenistan.svg  Turkmenistan Asia 86,000
Flag of Malaysia.svg  Malaysia Asia 75,000
Flag of Egypt.svg  Egypt Africa 65,000
Flag of Indonesia.svg  Indonesia Asia 57,000
Flag of the United Arab Emirates.svg  United Arab Emirates Asia 57,000
Flag of Uzbekistan.svg  Uzbekistan Asia 48,000
Flag of Argentina.svg  Argentina South America 43,000
Flag of Oman.svg  Oman Asia 41,000
Flag of Nigeria.svg  Nigeria Africa 40,000
Flag of the United Kingdom.svg  United Kingdom Europe 38,000
Flag of Pakistan.svg  Pakistan Asia 37,000
Flag of Azerbaijan.svg  Azerbaijan Asia/Europe 34,000
Flag of India.svg  India Asia 33,000
Flag of Mexico.svg  Mexico North America 31,000
Flag of Thailand.svg  Thailand Asia 31,000
Flag of Kazakhstan.svg  Kazakhstan Asia/Europe 27,000
Flag of Trinidad and Tobago.svg  Trinidad and Tobago South America 27,000
Flag of Bangladesh.svg  Bangladesh Asia 25,000
Flag of Brazil.svg  Brazil South America 23,000
Flag of Israel.svg  Israel Asia 23,000
Flag of Kuwait.svg  Kuwait Asia 19,000
Flag of Ukraine.svg  Ukraine Europe 19,000
Flag of Bahrain.svg  Bahrain Asia 18,000
Flag of the Netherlands.svg  Netherlands Europe 18,000
Flag of Venezuela.svg  Venezuela South America 18,000
Flag of Myanmar.svg  Myanmar Asia 17,000
Bandera de Bolivia (Estado).svg  Bolivia South America 14,000
Flag of Libya.svg  Libya Africa 12,000
Flag of Peru.svg  Peru South America 12,000
Flag of Brunei.svg  Brunei Asia 11,000
Flag of Colombia.svg  Colombia South America 11,000
Flag of Papua New Guinea.svg  Papua New Guinea Oceania 11,000
Flag of Iraq.svg  Iraq Asia 9,900
Flag of Romania.svg  Romania Europe 9,500
Flag of Vietnam.svg  Vietnam Asia 7,700
Flag of Equatorial Guinea.svg  Equatorial Guinea Africa 6,800
Flag of Poland.svg  Poland Europe 5,600
Flag of Angola.svg  Angola Africa 5,500
Flag of Mozambique.svg  Mozambique Africa 5,300
Flag of Germany.svg  Germany Europe 4,800
Flag of New Zealand.svg  New Zealand Oceania 3,800
Flag of Ghana.svg  Ghana Africa 3,200
Flag of Italy.svg  Italy Europe 3,100
Flag of Syria.svg  Syria Asia 3,100
Flag of East Timor.svg  Timor-Leste Asia 2,900
Flag of Cameroon.svg  Cameroon Africa 2,600
Flag of Cote d'Ivoire.svg  Cote d'Ivoire Africa 2,600
Flag of the Philippines.svg  Philippines Asia 2,300
Flag of Japan.svg  Japan Asia 2,200
Flag of Denmark.svg  Denmark Europe 1,900
Flag of Tanzania.svg  Tanzania Africa 1,800
Flag of Hungary.svg  Hungary Europe 1,500
Flag of Ireland.svg  Ireland Europe 1,400
Flag of Tunisia.svg  Tunisia Africa 1,300
Flag of Chile.svg  Chile South America 1,200
Flag of Croatia.svg  Croatia Europe 700
Flag of Cuba.svg  Cuba North America 700
Flag of Austria.svg  Austria Europe 600
Flag of Gabon.svg  Gabon Africa 500
Flag of the Republic of the Congo.svg  Congo, Republic of the Africa 400
Flag of Serbia.svg  Serbia Europe 400
Flag of Turkey.svg  Turkey Asia/Europe 400
Flag of Ecuador.svg  Ecuador South America 300
Flag of the Czech Republic.svg  Czech Republic Europe 200
Flag of Jordan.svg  Jordan Asia 200
Flag of Yemen.svg  Yemen Asia 200
Flag of Albania.svg  Albania Europe <100
Flag of Barbados.svg  Barbados North America <100
Flag of Belarus.svg  Belarus Europe <100
Flag of Belgium (civil).svg  Belgium Europe <100
Flag of Bulgaria.svg  Bulgaria Europe <100
Flag of France.svg  France Europe <100
Flag of Georgia.svg  Georgia Europe/Asia <100
Flag of Guatemala.svg  Guatemala North America <100
Flag of Kyrgyzstan (2023).svg  Kyrgyzstan Asia <100
Flag of Morocco.svg  Morocco Africa <100
Flag of Niger.svg  Niger Africa <100
Flag of Rwanda.svg  Rwanda Africa <100
Flag of Senegal.svg  Senegal Africa <100
Flag of Slovakia.svg  Slovakia Europe <100
Flag of Slovenia.svg  Slovenia Europe <100
Flag of South Africa.svg  South Africa Africa <100
Flag of Spain.svg  Spain Europe <100
Flag of the Republic of China.svg  Taiwan Asia <100
Flag of Tajikistan.svg  Tajikistan Asia <100
World4,108,000

See also

Related Research Articles

<span class="mw-page-title-main">Natural gas</span> Gaseous fossil fuel

Natural gas is a naturally occurring mixture of gaseous hydrocarbons consisting primarily of methane (97%) in addition to various smaller amounts of other higher alkanes. Low levels of trace gases like carbon dioxide, nitrogen, hydrogen sulfide, and helium are also usually present. Methane is colorless and odorless, and the second largest greenhouse gas contributor to global climate change after carbon dioxide. Because natural gas is odorless, odorizers such as mercaptan are commonly added to it for safety so that leaks can be readily detected.

<span class="mw-page-title-main">Petroleum</span> Naturally occurring flammable liquid

Petroleum, also known as crude oil or simply oil, is a naturally occurring yellowish-black liquid mixture of mainly hydrocarbons, and is found in geological formations. The name petroleum covers both naturally occurring unprocessed crude oil and petroleum products that consist of refined crude oil.

<span class="mw-page-title-main">Peak oil</span> Point in time when the maximum rate of petroleum extraction is reached

Peak oil is the theorized point in time when the maximum rate of global oil production will occur, after which oil production will begin an irreversible decline. The primary concern of peak oil is that global transportation heavily relies upon the use of gasoline and diesel fuel. Switching transportation to electric vehicles, biofuels, or more fuel-efficient forms of travel may help reduce oil demand.

<span class="mw-page-title-main">Energy Information Administration</span> US Department of Energy agency

The U.S. Energy Information Administration (EIA) is a principal agency of the U.S. Federal Statistical System responsible for collecting, analyzing, and disseminating energy information to promote sound policymaking, efficient markets, and public understanding of energy and its interaction with the economy and the environment. EIA programs cover data on coal, petroleum, natural gas, electric, renewable and nuclear energy. EIA is part of the U.S. Department of Energy.

<span class="mw-page-title-main">Energy in Japan</span> Overview of the production, consumption, import and export of energy and electricity in Japan

Japan is a major consumer of energy, ranking fifth in the world by primary energy use. Fossil fuels accounted for 88% of Japan's primary energy in 2019. Japan imports most of its energy due to scarce domestic resources. As of 2022, the country imports 97% of its oil and is the larger LNG importer globally.

<span class="mw-page-title-main">Energy policy of the United States</span> Where and how the United States gets electrical and other power

The energy policy of the United States is determined by federal, state, and local entities. It addresses issues of energy production, distribution, consumption, and modes of use, such as building codes, mileage standards, and commuting policies. Energy policy may be addressed via legislation, regulation, court decisions, public participation, and other techniques.

<span class="mw-page-title-main">Electric energy consumption</span> Worldwide consumption of electricity

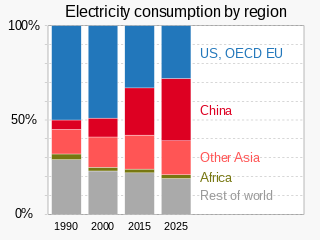
Electric energy consumption is energy consumption in the form of electrical energy. About a fifth of global energy is consumed as electricity: for residential, industrial, commercial, transportation and other purposes. Quickly increasing this share by further electrification is extremely important to limit climate change, because most other energy is consumed by burning fossil fuels thus emitting greenhouse gases which trap heat.

<span class="mw-page-title-main">Energy in the United States</span>

Energy in the United States is obtained from a diverse portfolio of sources, although the majority came from fossil fuels in 2021, as 36% of the nation's energy originated from petroleum, 32% from natural gas, and 11% from coal. Electricity from nuclear power supplied 8% and renewable energy supplied 12%, which includes biomass, wind, hydro, solar and geothermal.

<span class="mw-page-title-main">United States energy independence</span> Idea of eliminating the need for the United States to import foreign sources of energy

United States energy independence is the concept of eliminating or substantially reducing import of petroleum to satisfy the nation's need for energy. Some proposals for achieving energy independence would permit imports from the neighboring nations of Canada and Mexico, in which case it would be called North American energy independence. Energy independence is espoused by those who want to leave the US unaffected by global energy supply disruptions and would restrict reliance upon politically unstable states for its energy security.

<span class="mw-page-title-main">Energy in Iran</span> Overview of the production, consumption, import and export of energy and electricity in Iran

Iran possesses significant energy reserves, holding the position of the world's third-largest in proved oil reserves and the second-largest in natural gas reserves as of 2021. At the conclusion of the same year, Iran's share comprised 24% of the oil reserves in the Middle East and 12% of the worldwide total.

<span class="mw-page-title-main">Energy in Brazil</span> Overview of the production, consumption, import and export of energy and electricity in Brazil

Brazil is the 7th largest energy consumer in the world and the largest in South America. At the same time, it is an important oil and gas producer in the region and the world's second largest ethanol fuel producer. The government agencies responsible for energy policy are the Ministry of Mines and Energy (MME), the National Council for Energy Policy (CNPE), the National Agency of Petroleum, Natural Gas and Biofuels (ANP) and the National Agency of Electricity (ANEEL). State-owned companies Petrobras and Eletrobras are the major players in Brazil's energy sector, as well as Latin America's.

<span class="mw-page-title-main">Shale gas</span> Natural gas trapped in shale formations

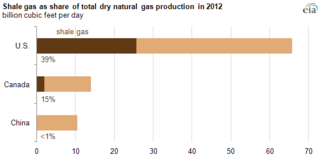
Shale gas is an unconventional natural gas that is found trapped within shale formations. Since the 1990s a combination of horizontal drilling and hydraulic fracturing has made large volumes of shale gas more economical to produce, and some analysts expect that shale gas will greatly expand worldwide energy supply.

<span class="mw-page-title-main">Coal power in the United States</span>

Coal generated about 19.5% of the electricity at utility-scale facilities in the United States in 2022, down from 38.6% in 2014 and 51% in 2001. In 2021, coal supplied 9.5 quadrillion British thermal units (2,800 TWh) of primary energy to electric power plants, which made up 90% of coal's contribution to U.S. energy supply. Utilities buy more than 90% of the coal consumed in the United States. There were over 200 coal powered units across the United States in 2022. Coal plants have been closing since the 2010s due to cheaper and cleaner natural gas and renewables. Due to measures such as scrubbers air pollution from the plants kills far fewer people nowadays, but deaths in 2020 from PM 2.5 have been estimated at 1600. Environmentalists say that political action is needed to close them faster, to also reduce greenhouse gas emissions by the United States and better limit climate change.

<span class="mw-page-title-main">Petroleum in the United States</span>

Petroleum has been a major industry in the United States since the 1859 Pennsylvania oil rush around Titusville, Pennsylvania. Commonly characterized as "Big Oil", the industry includes exploration, production, refining, transportation, and marketing of oil and natural gas products. The leading crude oil-producing areas in the United States in 2023 were Texas, followed by the offshore federal zone of the Gulf of Mexico, North Dakota and New Mexico.

The National Energy Modeling System (NEMS) is an economic and energy model of United States energy markets created at the U.S. Energy Information Administration (EIA). NEMS projects the production, consumption, conversion, import, export, and pricing of energy. The model relies on assumptions for economic variables, including world energy market interactions, resource availability, technological choice and characteristics, and demographics.

<span class="mw-page-title-main">Natural gas in China</span> Overview of natural gas use in China

Between 2009 and 2014, gas consumption, production, and imports in China have grown dramatically, with two-digit growth. According to CNPC, the installed capacity of gas-fired power plants in the country is expected to reach around 138 million-154 million kilowatts in 2025, and further grow to 261 million-308 million kilowatts by 2030.

<span class="mw-page-title-main">Natural gas in the United States</span>

Natural gas was the United States' largest source of energy production in 2016, representing 33 percent of all energy produced in the country. Natural gas has been the largest source of electrical generation in the United States since July 2015.

References

  1. "Natural Gas 101: What is Dry Natural Gas? – Welcome to Well Said Coterra". 2019-02-21. Retrieved 2024-04-18.
  2. "natural gas production Annual". EIA. United States Department of Energy. Retrieved 15 April 2024.