This article needs to be updated.(March 2023) |

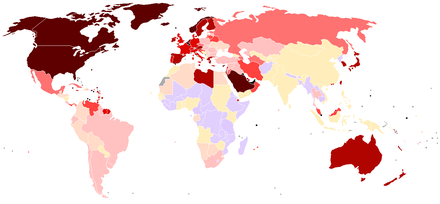
> 0.07
0.07 - 0.05
0.05 - 0.035
0.035 - 0.025
0.025 - 0.02
0.02 - 0.015
0.015 - 0.01
0.01 - 0.005
0.005 - 0.0015
< 0.0015

This is a list of countries by oil consumption. [1] [2] In 2022, the International Energy Agency (IEA) announced that the total worldwide oil consumption would rise by 2% [3] year over year compared to 2021 despite the COVID-19 pandemic.
| Rank | Country/Region | Oil consumption (bbl/day) | Year | % |
|---|---|---|---|---|
| - | World (incl biofuels) | 105,000,000 [4] | 2022 | 100 |
| 1 | 21,000,000 [5] | 2022 | 20 | |
| - | 15,000,000 [6] | 2017 | ||
| 2 | 16,000,000 | 2022 | 15.2 | |
| - | 6,226,000 | 2019 | ||
| 3 | 5,162,787 [7] | 2022 | ||
| 4 | 5,000,000 | 2022 | 4.8 | |
| 5 | 4,500,000 | 2022 | 4.3 | |
| 6 | 3,500,000 | 2022 | 3.3 | |
| 7 | 3,200,000 | 2022 | 3.1 | |
| 8 | 3,000,000 | 2022 | 2.9 | |
| 9 | 2,800,000 | 2022 | 2.7 | |
| 10 | 2,500,000 | 2022 | 2.4 | |
| 11 | 2,200,000 | 2022 | 2.1 | |
| 12 | 2,000,000 | 2022 [8] | 1.9 | |
| 13 | 1,800,000 | 2022 | 1.7 | |
| 14 | 1,700,000 | 2022 | 1.6 | |
| 15 | 1,600,000 | 2022 | 1.5 | |
| 16 | 1,500,000 | 2022 | 1.4 | |
| 17 | 1,400,000 | 2022 | 1.3 | |
| 18 | 1,300,000 | 2022 | 1.2 | |
| 19 | 1,200,000 | 2022 | 1.1 | |
| 20 | 1,100,000 | 2022 | 1.1 | |
| 21 | 1,100,000 | 2022 | 1.1 | |
| 22 | 1,100,000 | 2022 | 1.1 | |
| 23 | 950,000 | 2022 | 0.9 | |
| 24 | 900,000 | 2022 | 0.9 | |
| 25 | 880,000 | 2022 | 0.8 | |
| 26 | 850,000 | 2022 | 0.8 | |
| 27 | 800,000 | 2022 | 0.8 | |
| 28 | 770,000 | 2022 | 0.7 | |
| 29 | 750,000 | 2022 | 0.7 | |
| 30 | 720,000 | 2022 | 0.7 | |
| 31 | 700,000 | 2022 | 0.7 | |
| 32 | 650,000 | 2022 | 0.6 | |
| 33 | 600,000 | 2022 | 0.6 | |
| 34 | 580,000 | 2022 | 0.6 | |
| 35 | 560,000 | 2022 | 0.5 | |
| 36 | 540,000 | 2022 | 0.5 | |
| 37 | 520,000 | 2022 | 0.5 | |
| 38 | 480,000 | 2022 | 0.5 | |
| 39 | 420,000 | 2022 | 0.4 | |
| 40 | 400,000 | 2022 | ||
| 41 | 360,000 | 2022 | ||
| 42 | 340,000 | 2022 | ||
| 43 | 300,000 | 2022 | ||
| 44 | 280,000 | 2022 | ||
| 45 | 262,000 | 2011 est. | ||
| 46 | 250,000 | 2022 | ||
| 47 | 250,000 | 2022 | ||
| 48 | 250,000 | 2022 | ||
| 49 | 250,000 | 2022 | ||
| 50 | 244,200 | 2011 est. | ||
| 51 | 240,000 | 2022 | ||
| 52 | 240,000 | 2022 | ||
| 53 | 230,000 | 2022 | ||
| 54 | 230,000 | 2022 | ||
| 55 | 220,000 | 2022 | ||
| 56 | 204,800 | 2011 est. | ||
| 57 | 200,000 | 2022 | ||
| 58 | 189,700 | 2012 est. | ||
| 59 | 188,800 | 2011 est. | ||
| 60 | 177,000 | 2011 est. | ||
| 61 | 168,000 | 2011 est. | ||
| 62 | 160,200 | 2011 est. | ||
| 63 | 151,600 | 2011 est. | ||
| 64 | 150,200 | 2011 est. | ||
| 65 | 148,900 | 2011 est. | ||
| 66 | 145,000 | 2011 est. | ||
| 67 | 144,000 | 2011 est. | ||
| 68 | 141,100 | 2011 est. | ||
| 69 | 140,000 | 2022 est. | ||
| 70 | 137,100 | 2011 est. | ||
| 71 | 130,000 | 2022 | ||
| 72 | 122,300 | 2011 est. | ||
| 73 | 112,700 | 2011 est. | ||
| 74 | 108,900 | 2011 est. | ||
| 75 | 107,000 | 2011 est. | ||
| 76 | 106,700 | 2011 est. | ||
| 77 | 106,100 | 2011 est. | ||
| 78 | 98,890 | 2011 est. | ||
| 79 | 98,000 | 2011 est. | ||
| 80 | 95,450 | 2011 est. | ||
| 81 | 88,380 | 2011 est. | ||
| 82 | 83,910 | 2011 est. | ||
| 83 | 80,810 | 2011 est. | ||
| 84 | 79,430 | 2011 est. | ||
| 85 | 79,410 | 2011 est. | ||
| 86 | 78,520 | 2011 est. | ||
| 87 | 74,410 | 2012 est. | ||
| 88 | 72,770 | 2013 est. | ||
| 89 | 72,000 | 2010 est. | ||
| 90 | 70,390 | 2011 est. | ||
| 91 | 61,590 | 2011 est. | ||
| 92 | 61,380 | 2011 est. | ||
| 93 | 58,430 | 2011 est. | ||
| 94 | 58,150 | 2011 est. | ||
| 95 | 55,560 | 2013 est. | ||
| 96 | 52,930 | 2011 est. | ||
| 97 | 51,450 | 2012 est. | ||
| 98 | 51,100 | 2011 est. | ||
| 99 | 50,200 | 2011 est. | ||
| 100 | 49,080 | 2011 est. | ||
| 101 | 45,300 | 2011 est. | ||
| 102 | 44,040 | 2011 est. | ||
| 103 | 43,310 | 2011 est. | ||
| 104 | 40,620 | 2011 est. | ||
| 105 | 40,600 | 2011 est. | ||
| 106 | 39,000 | 2015 est. | ||
| 107 | 39,000 | 2022 | ||
| 108 | 38,390 | 2011 est. | ||
| 109 | 36,320 | 2011 est. | ||
| 110 | 36,300 | 2011 est. | ||
| 111 | 31,340 | 2011 est. | ||
| 112 | 30,690 | 2011 est. | ||
| 113 | 29,410 | 2011 est. | ||
| 114 | 29,310 | 2011 est. | ||
| 115 | 29,170 | 2011 est. | ||
| 116 | 28,670 | 2011 est. | ||
| 117 | 27,540 | 2011 est. | ||
| 118 | 26,820 | 2011 est. | ||
| 119 | 26,340 | 2011 est. | ||
| 120 | 24,920 | 2011 est. | ||
| 121 | 24,710 | 2011 est. | ||
| 122 | 24,630 | 2011 est. | ||
| 123 | 22,990 | 2011 est. | ||
| 124 | 21,610 | 2011 est. | ||
| 125 | 20,090 | 2013 est. | ||
| 126 | 19,800 | 2016 est. | ||
| 127 | 19,580 | 2011 est. | ||
| 128 | 19,520 | 2011 est. | ||
| 129 | 19,260 | 2011 est. | ||
| 130 | 19,030 | 2011 est. | ||
| 131 | 18,430 | 2011 est. | ||
| 132 | 18,120 | 2011 est. | ||
| 133 | 17,810 | 2011 est. | ||
| 134 | 17,490 | 2011 est. | ||
| 135 | 17,480 | 2011 est. | ||
| 136 | 17,280 | 2011 est. | ||
| 137 | 16,930 | 2011 est. | ||
| 138 | 16,640 | 2011 est. | ||
| 139 | 15,800 | 2011 est. | ||
| 140 | 15,420 | 2011 est. | ||
| 141 | 15,320 | 2012 est. | ||
| 142 | 15,000 | 2012 est. | ||
| 143 | 14,640 | 2011 est. | ||
| 144 | 14,490 | 2011 est. | ||
| 145 | 14,100 | 2011 est. | ||
| 146 | 14,000 | 2011 est. | ||
| 147 | 13,640 | 2011 est. | ||
| 148 | 12,460 | 2011 est. | ||
| 149 | 12,060 | 2011 est. | ||
| 150 | 10,910 | 2011 est. | ||
| 151 | 10,710 | 2011 est. | ||
| 152 | 10,240 | 2011 est. | ||
| 153 | 9,960 | 2011 est. | ||
| 154 | 8,768 | 2011 est. | ||
| 155 | 8,671 | 2011 est. | ||
| 156 | 8,339 | 2011 est. | ||
| 157 | 8,000 | 2011 est. | ||
| 158 | 7,793 | 2011 est. | ||
| 159 | 7,376 | 2013 est. | ||
| 160 | 7,044 | 2011 est. | ||
| 161 | 6,875 | 2011 est. | ||
| 162 | 5,661 | 2011 est. | ||
| 163 | 5,659 | 2011 est. | ||
| 164 | 5,629 | 2011 est. | ||
| 165 | 5,245 | 2011 est. | ||
| 166 | 5,115 | 2011 est. | ||
| 167 | 5,000 | 2011 est. | ||
| 168 | 4,994 | 2011 est. | ||
| 169 | 4,871 | 2011 est. | ||
| 170 | 4,567 | 2011 est. | ||
| 171 | 4,480 | 2011 est. | ||
| 172 | 4,446 | 2011 est. | ||
| 173 | 4,229 | 2011 est. | ||
| 174 | 3,897 | 2011 est. | ||
| 175 | 3,533 | 2011 est. | ||
| 176 | 3,500 | 2015 est. | ||
| 177 | 3,181 | 2011 est. | ||
| 178 | 3,175 | 2011 est. | ||
| 179 | 3,141 | 2011 est. | ||
| 180 | 2,922 | 2011 est. | ||
| 181 | 2,922 | 2011 est. | ||
| 182 | 2,803 | 2011 est. | ||
| 183 | 2,755 | 2011 est. | ||
| 184 | 2,747 | 2012 est. | ||
| 185 | 2,608 | 2011 est. | ||
| 186 | 2,290 | 2011 est. | ||
| 187 | 1,948 | 2011 est. | ||
| 188 | 1,948 | 2011 est. | ||
| 189 | 1,817 | 2011 est. | ||
| 190 | 1,777 | 2011 est. | ||
| 191 | 1,728 | 2011 est. | ||
| 192 | 1,719 | 2011 est. | ||
| 193 | 1,588 | 2011 est. | ||
| 194 | 1,496 | 2011 est. | ||
| 195 | 1,340 | 2015 est. | ||
| 196 | 1,221 | 2011 est. | ||
| 197 | 1,200 | 2015 est. | ||
| 198 | 1,100 | 2015 est. | ||
| 199 | 1,025 | 2011 est. | ||
| 200 | 1,000 | 2015 est. | ||
| 201 | 1,000 | 2015 est. | ||
| 202 | 1,000 | 2015 est. | ||
| 203 | 630 | 2015 est. | ||
| 204 | 570 | 2015 est. | ||
| 205 | 530 | 2015 est. | ||
| 206 | 400 | 2015 est. | ||
| 207 | 400 | 2015 est. | ||
| 208 | 300 | 2015 est. | ||
| 209 | 80 | 2015 est. | ||
| 210 | 60 | 2015 est. |