Temperature record of the last 2,000 years

Last updated
Global average temperatures show that the Medieval Warm Period was not a planet-wide phenomenon, and that the Little Ice Age was not a distinct planet-wide time period but rather the end of a long temperature decline that preceded recent global warming. 2000+ year global temperature including Medieval Warm Period and Little Ice Age - Ed Hawkins.svg
Global average temperatures show that the Medieval Warm Period was not a planet-wide phenomenon, and that the Little Ice Age was not a distinct planet-wide time period but rather the end of a long temperature decline that preceded recent global warming.

The temperature record of the last 2,000 years is reconstructed using data from climate proxy records in conjunction with the modern instrumental temperature record which only covers the last 170 years at a global scale. Large-scale reconstructions covering part or all of the 1st millennium and 2nd millennium have shown that recent temperatures are exceptional: the Intergovernmental Panel on Climate Change Fourth Assessment Report of 2007 concluded that "Average Northern Hemisphere temperatures during the second half of the 20th century were very likely higher than during any other 50-year period in the last 500 years and likely the highest in at least the past 1,300 years." The curve shown in graphs of these reconstructions is widely known as the hockey stick graph because of the sharp increase in temperatures during the last century. As of 2010 this broad pattern was supported by more than two dozen reconstructions, using various statistical methods and combinations of proxy records, with variations in how flat the pre-20th-century "shaft" appears. Sparseness of proxy records results in considerable uncertainty for earlier periods. [2]

Contents

Individual proxy records, such as tree ring widths and densities used in dendroclimatology, are calibrated against the instrumental record for the period of overlap. Networks of such records are used to reconstruct past temperatures for regions: tree ring proxies have been used to reconstruct Northern Hemisphere extratropical temperatures (within the tropics trees do not form rings) but are confined to land areas and are scarce in the Southern Hemisphere which is largely ocean. Wider coverage is provided by multiproxy reconstructions, incorporating proxies such as lake sediments, ice cores and corals which are found in different regions, and using statistical methods to relate these sparser proxies to the greater numbers of tree ring records. The "Composite Plus Scaling" (CPS) method is widely used for large-scale multiproxy reconstructions of hemispheric or global average temperatures; this is complemented by Climate Field Reconstruction (CFR) methods which show how climate patterns have developed over large spatial areas, making the reconstruction useful for investigating natural variability and long-term oscillations as well as for comparisons with patterns produced by climate models.

During the 1,900 years before the 20th century, it is likely that the next warmest period was from 950 to 1100, with peaks at different times in different regions. This has been called the Medieval Warm Period, and some evidence suggests widespread cooler conditions during a period around the 17th century known as the Little Ice Age. In the "hockey stick controversy", climate change deniers have asserted that the Medieval Warm Period was warmer than at present, and have disputed the data and methods of climate reconstructions.

Temperature change in the last 2,000 years

According to IPCC Sixth Assessment Report, in the last 170 years, humans have caused the global temperature to increase to the highest level in the last 2,000 years. The current multi-century period is the warmest in the past 100,000 years. [3] The temperature in the years 2011-2020 was 1.09 °C higher than in 1859–1890. The temperature on land rose by 1.59 °C while over the ocean it rose by 0.88 °C. [3] In 2020 the temperature was 1.2 °C above the pre-industrial era. [4] In September 2023 the temperature was 1.75 °C above pre-industrial level and during the entire year of 2023 is expected to be 1.4 °C above it. [5]

General techniques and accuracy

By far the best observed period is from 1850 to the present day, with coverage improving over time. Over this period the recent instrumental record, mainly based on direct thermometer readings, has approximately global coverage. It shows a general warming in global temperatures.

Before this time various proxies must be used. These proxies are less accurate than direct thermometer measurements, have lower temporal resolution, and have less spatial coverage. Their only advantage is that they enable a longer record to be reconstructed. Since the direct temperature record is more accurate than the proxies (indeed, it is needed to calibrate them) it is used when available: i.e., from 1850 onwards.

Quantitative methods using proxy data

As there are few instrumental records before 1850, temperatures before then must be reconstructed based on proxy methods. One such method, based on principles of dendroclimatology, uses the width and other characteristics of tree rings to infer temperature. The isotopic composition of snow, corals, and stalactites can also be used to infer temperature. Other techniques which have been used include examining records of the time of crop harvests, the treeline in various locations, and other historical records to make inferences about the temperature. These proxy reconstructions are indirect inferences of temperature and thus tend to have greater uncertainty than instrumental data.

Most proxy records have to be calibrated against local temperature records during their period of overlap, to estimate the relationship between temperature and the proxy. The longer history of the proxy is then used to reconstruct temperature from earlier periods.

Proxy records must be averaged in some fashion if a global or hemispheric record is desired. The "Composite Plus Scaling" (CPS) method is widely used for large-scale multiproxy reconstructions of hemispheric or global average temperatures. This is complemented by Climate Field Reconstruction (CFR) methods which show how climate patterns have developed over large spatial areas.

Considerable care must be taken in the averaging process; for example, if a certain region has a large number of tree ring records, a simple average of all the data would strongly over-weight that region, and statistical techniques are used to avoid such over-weighting. In the Mann, Bradley & Hughes 1998 and Mann, Bradley & Hughes 1999 CFR reconstructions, principal components analysis was used to combine some of these regional records before they were globally combined. An important distinction is between so-called 'multi-proxy' reconstructions, which attempt to obtain a global temperature reconstruction by using multiple proxy records distributed over the globe and more regional reconstructions. Usually, the various proxy records are combined arithmetically, in some weighted average. More recently, Osborn and Briffa used a simpler technique, counting the proportion of records that are positive, negative or neutral in any time period. [6] This produces a result in general agreement with the conventional multi-proxy studies.

The 2007 IPCC Fourth Assessment Report cited 14 reconstructions, 10 of which covered 1,000 years or longer, to support its conclusion that "Average Northern Hemisphere temperatures during the second half of the 20th century were very likely higher than during any other 50-year period in the last 500 years and likely the highest in at least the past 1,300 years". [7]

Qualitative reconstruction using historical records

It is also possible to use historical data such as times of grape harvests, sea-ice-free periods in harbours and diary entries of frost or heatwaves to produce indications of when it was warm or cold in particular regions. These records are harder to calibrate, are often only available sparsely through time, may be available only from developed regions, and are unlikely to come with good error estimates. These historical observations of the same time period show periods of both warming and cooling.

Limitations

The apparent differences between the quantitative and qualitative approaches are not fully reconciled. The reconstructions mentioned above rely on various assumptions to generate their results. If these assumptions do not hold, the reconstructions would be unreliable. For quantitative reconstructions, the most fundamental assumptions are that proxy records vary with temperature and that non-temperature factors do not confound the results. In the historical records temperature fluctuations may be regional rather than hemispheric in scale.

In a letter to Nature Bradley, Hughes & Mann (2006) pointed at the original title of their 1998 article: Northern Hemisphere temperatures during the past millennium: inferences, uncertainties, and limitations [8] and pointed out more widespread high-resolution data are needed before more confident conclusions can be reached and that the uncertainties were the point of the article.

History

In the 1960s, Hubert Lamb generalised from historical documents and temperature records of central England to propose a Medieval Warm Period in the North Atlantic region, followed by Little Ice Age. This was discussed in the IPCC First Assessment Report with cautions that the medieval warming might not have been global. Using proxy indicators for quantitative estimates of past temperature record had developed sporadically from the 1930s onwards, and Bradley & Jones 1993 introduced the "Composite Plus Scaling" (CPS) method. [9] [10] Their reconstruction back to 1400 featured in the IPCC Second Assessment Report.

The Michael E. Mann, Raymond S. Bradley and Malcolm K. Hughes reconstruction (Mann, Bradley & Hughes 1998, MBH98) showed global patterns of annual surface temperature, and average hemispheric temperatures back to 1400 with emphasising on uncertainties. [11]

Jones et al. 1998 independently produced a CPS reconstruction extending back for a thousand years, and Mann, Bradley & Hughes 1999 (MBH99) used the MBH98 methodology to extend their study back to 1000. [12] [13] The term hockey stick was used by the climatologist Jerry Mahlman to describe the pattern this showed, envisaging a graph that is relatively flat to 1900 as forming an ice hockey stick's "shaft", followed by a sharp increase corresponding to the "blade". [14] [15]

A version of the MBH99 graph was featured prominently in the 2001 IPCC Third Assessment Report (TAR), which also drew on Jones et al. 1998 and three other reconstructions to support the conclusion that, in the Northern Hemisphere, the 1990s was likely to have been the warmest decade and 1998 the warmest year during the past 1,000 years. The graph was featured in publicity, and became a focus of dispute for those opposed to the strengthening scientific consensus that late 20th century warmth was exceptional. [16]

In 2003, as lobbying over the 1997 Kyoto Protocol intensified, efforts by the Bush administration to remove climate reconstructions from the first Environmental Protection Agency and Jim Inhofe's Senate speech claiming that man-made global warming is a hoax both drew on the Soon and Baliunas controversy. [17] Later in 2003, Stephen McIntyre and Ross McKitrick published McIntyre & McKitrick 2003 disputing data in the MBH98 paper, but their argument was refuted. In 2004 Hans von Storch said that the MBH98 statistical techniques understated variability, but he erred in saying this undermined the overall graph. [12] [18] In 2005 McIntyre and McKitrick criticised the principal components analysis methodology in MBH98 and MBH99, but Huybers 2005 and Wahl & Ammann 2007 pointed to errors made by McIntyre and McKitrick. The National Research Council North Report in 2006 supported MBH with minor caveats. [19] The Wegman Report supported McIntyre and McKitrick's study, but was subsequently discredited. Arguments against the MBH studies were reintroduced as part of the Climatic Research Unit email controversy, but dismissed by eight independent investigations.

The test in science is whether findings can be replicated using different data and methods. More than two dozen reconstructions, using various statistical methods and combinations of proxy records, have supported the broad consensus shown in the original 1998 hockey-stick graph, with variations in how flat the pre-20th century "shaft" appears. [2] The IPCC Fifth Assessment Report (AR5 WG1) of 2013 examined temperature variations during the last two millennia, and concluded that for average annual Northern Hemisphere temperatures, "the period 1983–2012 was very likely the warmest 30-year period of the last 800 years (high confidence) and likely the warmest 30-year period of the last 1400 years (medium confidence)". [20]

See also

Notes

  1. Hawkins, Ed (January 30, 2020). "2019 years". climate-lab-book.ac.uk. Archived from the original on February 2, 2020. ("The data show that the modern period is very different to what occurred in the past. The often quoted Medieval Warm Period and Little Ice Age are real phenomena, but small compared to the recent changes.")
  2. 1 2 Frank et al. 2010.
  3. 1 2 Masson-Delmotte, Valérie; Zhai, Panmao; Pirani, Anna; Connors, Sarah L.; Péan, Clotilde; Berger, Sophie; Caud, Nada; Chen, Yang; Goldfarb, Leah; Gomis, Melissa I.; Huang, Mengtian; Leitzell, Katherine; Lonnoy, Elisabeth; Matthews, J. B. Robin; Maycock, Tom K.; Waterfield, Tim; Yelekçi, Ozge; Yu, Rong; Zhou, Baiquan, eds. (2021-08-09). "Summary for Policymakers". Climate Change 2021: The Physical Science Basis. Contribution of Working Group I to the Sixth Assessment Report of the Intergovernmental Panel on Climate Change (PDF). IPCC / Cambridge University Press. Archived (PDF) from the original on 2021-08-13. Retrieved 2021-08-09.
  4. WMO Statement on the State of the Global Climate in 2020. WMO-No. 1264. Geneva: World Meteorological Organization. 2021. ISBN   978-92-63-11264-4. Archived from the original on 2021-04-19. Retrieved 2023-10-12.
  5. BORENSTEIN, SETH (5 October 2023). "September Heat Sets 'Mind-Blowing' Global Temperature Record". the European climate agency. Times. Retrieved 12 October 2023.
  6. Osborn & Briffa 2006; "A New Take on an Old Millennium". RealClimate. 2006-02-09.
  7. IPCC 2007, A: Palaeoclimatic Perspective Archived 2015-10-30 at the Wayback Machine ; see also Jansen et al. 2007, Sec. 6.6.1.1 What Do Reconstructions Based on Palaeoclimatic Proxies Show? Archived 2015-03-28 at the Wayback Machine .
  8. Mann, Bradley & Hughes 1999.
  9. Weart, Spencer R. (August 2021). "Fingerprints (1990s-2000s)". The Discovery of Global Warming .
  10. Jones et al. 2009.
  11. Wahl & Ammann 2007
  12. 1 2 Weart, Spencer R. (August 2021). "Hockey Stick and Hiatus". The Discovery of Global Warming ., Footnote 48
  13. Folland et al. 2001, 2.3.2.2 Multi-proxy synthesis of recent temperature change Archived 2011-06-04 at the Wayback Machine
  14. Richard Monastersky (September 5, 2003). "Climate Science on Trial". Chronicle of Higher Education . Retrieved 28 July 2013.
  15. BBC News, 16 July 2004.
  16. "Part three: Hockey stick graph took pride of place in IPCC report, despite doubts".
  17. Revkin, Andrew C. (5 August 2003), "Politics Reasserts Itself in the Debate Over Climate Change and Its Hazards", New York Times, retrieved 2012-02-26.
  18. The Decay of the Hockey Stick, Nature "Climate Feedback" blog post by von Storch. "...we do not think that McIntyre has substantially contributed in the published peer-reviewed literature to the debate about the statistical merits of the MBH and related method." (comment by von Storch & Zorita, May 7, 2007 07:35 PM, in response to multiple comments on their failure to acknowledge McIntyre and McKitrick's contributions)
  19. Pearce 2010, "Part four: Climate change debate overheated after sceptics grasped 'hockey stick'".
  20. Masson-Delmotte et al. 2013, Chapter 5, Executive Summary p. 286, and Section 5.3.5: Temperature Variations During the Last 2000 Years pp. 409–410 Archived 2017-12-06 at the Wayback Machine .

Related Research Articles

<span class="mw-page-title-main">Michael E. Mann</span> American physicist and climatologist

Michael Evan Mann is an American climatologist and geophysicist. He is the director of the Center for Science, Sustainability & the Media at the University of Pennsylvania. Mann has contributed to the scientific understanding of historic climate change based on the temperature record of the past thousand years. He has pioneered techniques to find patterns in past climate change and to isolate climate signals from noisy data.

Stephen McIntyre is a Canadian mining exploration company director, a former minerals prospector and semi-retired mining consultant whose work has included statistical analysis. He is the founder and editor of Climate Audit, a blog which analyses and discusses climate data. He is a critic of the temperature record of the past 1000 years and the data quality of NASA's Goddard Institute for Space Studies. He has made statistical critiques, with economist Ross McKitrick, of the hockey stick graph which shows that the increase in late 20th century global temperatures is unprecedented in the past 1,000 years.

<span class="mw-page-title-main">Hans von Storch</span> German climate scientist

Hans von Storch is a German climate scientist. He is a professor at the Meteorological Institute of the University of Hamburg, and Director of the Institute for Coastal Research at the Helmholtz Research Centre in Geesthacht, Germany. He is a member of the advisory boards of the journals Journal of Climate and Annals of Geophysics. He worked at the Max Planck Institute for Meteorology from 1986 to 1995 and headed the Statistical Analysis and Modelling research group there.

<span class="mw-page-title-main">Description of the Medieval Warm Period and Little Ice Age in IPCC reports</span>

The description of the Medieval Warm Period and Little Ice Age in IPCC reports has changed since the first report in 1990 as scientific understanding of the temperature record of the past 1000 years has improved. The Medieval Warm Period (MWP) and Little Ice Age (LIA) are the best-known temperature fluctuations in the last millennium.

<span class="mw-page-title-main">IPCC Third Assessment Report</span> Assessment of available scientific and socio-economic information on climate change by the IPCC

The IPCC Third Assessment Report (TAR), Climate Change 2001, is an assessment of available scientific and socio-economic information on climate change by the IPCC. Statements of the IPCC or information from the TAR were often used as a reference showing a scientific consensus on the subject of global warming. The Third Assessment Report (TAR) was completed in 2001 and consists of four reports, three of them from its Working Groups: Working Group I: The Scientific Basis; Working Group II: Impacts, Adaptation and Vulnerability; Working Group III: Mitigation; Synthesis Report. A number of the TAR's conclusions are given quantitative estimates of how probable it is that they are correct, e.g., greater than 66% probability of being correct. These are "Bayesian" probabilities, which are based on an expert assessment of all the available evidence.

<span class="mw-page-title-main">Global temperature record</span> Fluctuations of the Earths temperature over time

The global temperature record shows the fluctuations of the temperature of the atmosphere and the oceans through various spans of time. There are numerous estimates of temperatures since the end of the Pleistocene glaciation, particularly during the current Holocene epoch. Some temperature information is available through geologic evidence, going back millions of years. More recently, information from ice cores covers the period from 800,000 years before the present time until now. A study of the paleoclimate covers the time period from 12,000 years ago to the present. Tree rings and measurements from ice cores can give evidence about the global temperature from 1,000-2,000 years before the present until now. The most detailed information exists since 1850, when methodical thermometer-based records began. Modifications on the Stevenson-type screen were made for uniform instrument measurements around 1880.

<span class="mw-page-title-main">Richard A. Muller</span> American physicist

Richard A. Muller is an American physicist and emeritus professor of physics at the University of California, Berkeley. He was also a faculty senior scientist at the Lawrence Berkeley National Laboratory. In early 2010, Muller and his daughter Elizabeth Muller founded the group Berkeley Earth, an independent 501(c)(3) non-profit aimed at addressing some of the major concerns of the climate change skeptics, in particular the global surface temperature record. In 2016, Richard and Elizabeth Muller co-founded Deep Isolation, a private company seeking to dispose of nuclear waste in deep boreholes.

Climate Audit is a blog founded in 2005 by Steve McIntyre.

Climate Change 2007, the Fourth Assessment Report (AR4) of the United Nations Intergovernmental Panel on Climate Change (IPCC), was published in 2007 and is the fourth in a series of reports intended to assess scientific, technical and socio-economic information concerning climate change, its potential effects, and options for adaptation and mitigation. The report is the largest and most detailed summary of the climate change situation ever undertaken, produced by thousands of authors, editors, and reviewers from dozens of countries, citing over 6,000 peer-reviewed scientific studies. People from over 130 countries contributed to the IPCC Fourth Assessment Report, which took six years to produce. Contributors to AR4 included more than 2,500 scientific expert reviewers, more than 800 contributing authors, and more than 450 lead authors.

<span class="mw-page-title-main">Hockey stick graph (global temperature)</span> Graph in climate science

Hockey stick graphs present the global or hemispherical mean temperature record of the past 500 to 2000 years as shown by quantitative climate reconstructions based on climate proxy records. These reconstructions have consistently shown a slow long term cooling trend changing into relatively rapid warming in the 20th century, with the instrumental temperature record by 2000 exceeding earlier temperatures.

Malcolm K. Hughes is a meso-climatologist and Regents' Professor of Dendrochronology in the Laboratory for Tree-Ring Research at the University of Arizona.

<span class="mw-page-title-main">Divergence problem</span>

The divergence problem is an anomaly from the field of dendroclimatology, the study of past climate through observations of old trees, primarily the properties of their annual growth rings. It is the disagreement between instrumental temperatures and the temperatures reconstructed from latewood densities or, in some cases, from the widths of tree rings in far northern forests.

The Soon and Baliunas controversy involved the publication in 2003 of a review study written by the aerospace engineer Willie Soon and astronomer Sallie Baliunas in the journal Climate Research. In the review, the authors expressed disagreement with the hockey stick graph and argued that historical temperature changes were related to solar variation rather than greenhouse gas emissions as was the position of the Intergovernmental Panel on Climate Change and other researchers. The publication was quickly taken up by the George W. Bush administration as a basis for amending the first Environmental Protection Agency's Report on the Environment.

<span class="mw-page-title-main">Climatic Research Unit documents</span>

Climatic Research Unit documents including thousands of e-mails and other computer files were stolen from a server at the Climatic Research Unit of the University of East Anglia in a hacking incident in November 2009. The documents were redistributed first through several blogs of global warming deniers, who alleged that the documents indicated misconduct by leading climate scientists. A series of investigations rejected these allegations, while concluding that CRU scientists should have been more open with distributing data and methods on request. Precisely six committees investigated the allegations and published reports, finding no evidence of fraud or scientific misconduct. The scientific consensus that global warming is occurring as a result of human activity remained unchanged by the end of the investigations.

<i>The Hockey Stick Illusion</i> 2010 book by Andrew Montford

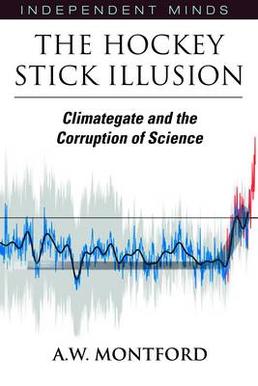
The Hockey Stick Illusion: Climategate and the Corruption of Science is a book written by Andrew Montford and published by Stacey International in 2010, which promotes climate change denial.

<span class="mw-page-title-main">Roman Warm Period</span> Warm weather period, 250 BC to AD 400

The Roman Warm Period, or Roman Climatic Optimum, was a period of unusually-warm weather in Europe and the North Atlantic that ran from approximately 250 BC to AD 400. Theophrastus wrote that date trees could grow in Greece if they were planted but that they could not set fruit there. That is still the case today, which implies that South Aegean mean summer temperatures in the 4th and the 5th centuries BC were within a degree of modern ones. That and other literary fragments from the time confirm that the Greek climate was basically the same then as around 2000. Tree rings from the Italian Peninsula in the late 3rd century BC indicate a time of mild conditions there around the time of Hannibal's crossing of the Alps with imported elephants in 218 BC.

<i>The Hockey Stick and the Climate Wars</i> 2012 book by Michael E. Mann

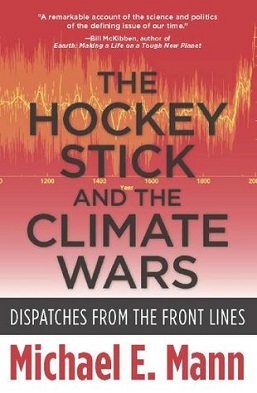
The Hockey Stick and the Climate Wars: Dispatches from the Front Lines is a 2012 book about climate change by the American climatologist and geophysicist Michael E. Mann. In the book Mann describes how he became a researcher investigating the temperature record of the past 1000 years and was lead author, with Raymond S. Bradley and Malcolm K. Hughes, on the 1999 reconstruction that was the first to be dubbed the hockey stick graph. He concisely explains the basics of climate science including statistical methodology dealing with paleoclimate proxy data, and examines the tactics which opponents of action on climate change use to distort the science and attack the reputations of climate scientists. The book describes both this controversy and the broader context of skepticism in science and contrarians rejecting evidence of human influence on climate.

The Wegman Report was prepared in 2006 by three statisticians led by Edward Wegman at the request of Rep. Joe Barton of the United States House Committee on Energy and Commerce to validate criticisms made by Stephen McIntyre and Ross McKitrick of reconstructions of the temperature record of the past 1000 years, in particular the reconstructions by Mann, Bradley and Hughes of what had been dubbed the hockey stick graph.

The North Report was a 2006 report evaluating reconstructions of the temperature record of the past two millennia, providing an overview of the state of the science and the implications for understanding of global warming. It was produced by a National Research Council committee, chaired by Gerald North, at the request of Representative Sherwood Boehlert as chairman of the U.S. House of Representatives Committee on Science.

References