Sources: 1790–1990, 2000, 2010, 2020, 2023[2][3][4][1] Chart does not include Indigenous population figures. Studies indicate that the Native American population in California in 1850 was close to 150,000 before declining to 15,000 by 1900.[5]
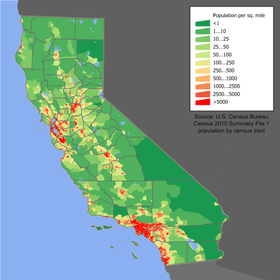
California is the most populated sub-national entity in North America. If it were an independent country, California would rank 38th in population in the world. It has a larger population than Australia.[6] Its population is one third larger than that of the next most populous state, Texas.[7] California surpassed New York to become the most populous state in 1962.[8] California's population growth has slowed dramatically in the 21st century.[9][10] In 2010, the state's five most populous counties were Los Angeles, San Diego, Orange, Riverside, and San Bernardino Counties, with Riverside County having the largest percentage increase in population.[11] The largest metro areas in California, as of 2010, are Los Angeles, San Francisco-Oakland-San Jose, San Diego, Riverside-San Bernardino, and Sacramento.[12] From 2006 until 2016, the state lost a net population of about 1 million people from emigration to other states,[13] yet the population of the state continued to grow due to immigration from overseas and more births than deaths.[14]
As of 2006, California had an estimated population of 37,172,015, more than 12 percent of the U.S. population. This includes a natural increase since the last census of 1,557,112 people (i.e., 2,781,539 births minus 1,224,427 deaths) and an increase due to net migration of 751,419 people. Immigration resulted in a net increase of 1,415,879 people, and migration from within the U.S. resulted in a net decrease of 564,100 people. California is the 13th fastest-growing state. As of 2023, the total fertility rate was 1.52 which is on par with Canada.[15]
No single ethnic group forms a majority of California's population, making the state a minority-majority state. Hispanics (of any race) are the largest single ethnic group in the state.[17]Spanish is the state's second most widely spoken language. Areas with especially large Spanish speaking populations include the Los Angeles metropolitan area, the California-Mexico border counties of San Diego and Imperial, and the San Joaquin Valley. Nearly 43% of Californian residents speak a language other than English at home, a proportion far higher than any other state.[18]
In 2011, there were an estimated 2.6 million undocumented immigrants residing in California.[19] California is home to almost 25% of the country's undocumented population, making up 6% of California's residents overall. Two-thirds of California's undocumented population have lived in the state for more than 10 years.[20]
About 52% of California's public school students in the 2011–2012 school year identified themselves as Hispanic or Latino and 26% as non-Hispanic Caucasian. The following ethnic groups made up the rest of the statewide public school student body: Asians (11%), African Americans (7%), Native Americans (0.7%), and Pacific Islanders (0.6%). Students of mixed race made up about 2% of the public schools. Hispanics have made up the majority of the state's public schools since 2010. Los Angeles Unified School District, the largest school district in California and second largest in the nation, is 73% Hispanic, 10% African American, 9% non-Hispanic Caucasian, 6% Asian, 0.5% Native American, and 0.4% Pacific Islander.[21]
In 2020, amid the COVID-19 pandemic, California's population fell for the first time in history, resulting in its first loss of a congressional seat.[22] The state's population declined again in 2021 and 2022.[23] The main causes of the decline are: a high mortality rate, a declining natality, a fall in international migration and emigration to other states.[23] The latter phenomenon is sometimes called California exodus.[24] Population loss was noticed in 34 out of 58 counties in the state between January 2020 and July 2022.[25] According to the California Department of Finance, the state's population will stay constant at around 39.5 million until 2060.[26][27] In 2020-2021 California saw an annual loss of 398,795 people while between 2021-2022 there was a lower loss in population at 113,649 people.[25] The slowing down of population loss as seen in 2022 would continue into 2023 seeing a loss of 75,423 people making it a 0.2% population loss from the previous year as compared to 2022 having a 0.3% loss in 2023.[28]
California – Racial and Ethnic Composition (NH = Non-Hispanic) Note: the US Census treats Hispanic/Latino as an ethnic category. This table excludes Latinos from the racial categories and assigns them to a separate category. Hispanics/Latinos may be of any race.
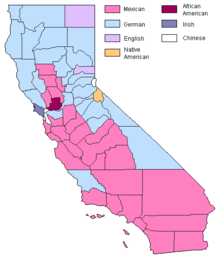
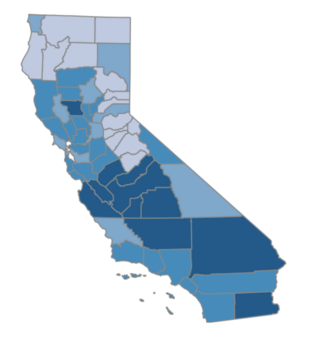
Racial and Ethnic Makeup of California excluding Hispanics from racial categories (2018) NH=Non-HispanicMost common ancestry in each county in 2000
According to the 2020 U.S. census, California's population was 34.7% Non-Hispanic White, 5.7% African American, 1.5% Native American, 16.1% Asian, 0.4% Pacific Islander, 13% Two or more races, and 39.4% Hispanic or Latino of any race.[34] Hispanics are the largest racial/ethnic group in California. Non-Hispanic Whites have decreased from about 76.3 – 78% of the state's population in 1970[35] to 36.6% in 2018.[33] While the population of minorities accounts for 100.7 million of 300 million U.S. residents, 20% of the national total live in California (2008).[36][37]
According to 2018 U.S. Census Bureau estimates, California's population was 59.5% White (36.6% Non-Hispanic White), 14.7% Asian, 13.8% Some Other Race, 5.8% Black or African American, 0.8% Native American and Alaskan Native, 0.4% Pacific Islander, and 5.1% from two or more races.[33] with others identifying as Some Other Race (34.4%), Multiracial (5.1%), Black (0.7%), American Indian and Alaskan Native (1.1%), Asian (0.5%), and Hawaiian and Pacific Islander (0.1%).[33] By ethnicity, 39.3% of the total population is Hispanic-Latino (of any race) and 60.7% is Non-Hispanic (of any race).[33]
California has the highest number, and second highest percentage, of Asian Americans by state. Only Hawaii has a higher Asian American percentage than California. While New Mexico and Texas have higher percentages of Hispanics, California has the highest total number of Hispanics of any U.S. state. Hispanics are the largest single ethnic group in the state.[38]
California has the largest population of White Americans in the U.S., totaling 21,453,934 residents as of the 2010 census. The state has the fifth largest population of African Americans in the U.S., an estimated 2,299,072 residents. California's Asian population is estimated at 4.9 million, approximately one-third of the nation's estimated 15 million Asian Americans. California's Native American population of 285,512 is the third-largest of any state, behind Arizona and Oklahoma.[42]
Since the 2000 U.S. census, California has been known as the second state in U.S. history (after Hawaii since its statehood in 1959) to have a non-White majority when excluding Hispanic Whites, and since 2014, the first state to have a Latino plurality surpass other racial/ethnic groups. The media discussed the possibility of Latinos becoming a majority in the 21st century,[43] for the first time since statehood (1850) when massive immigration of Anglo-Americans during the California Gold Rush of 1848–1849 reduced Spanish speakers to 20% of the population.
The most important Italian community in California is in North Beach District at San Francisco. 60% of Californian Italo-Americans are from northern Italy.[53] Others numerous groups are from Tuscany and Sicily.[53] Many Italians also live in San Diego, with Little Italy having San Diego's largest Italian population.
There is also a large Dutch community in California.[54] The Dutch settled in Redlands, Ontario, Ripon, and Bellflower.[55]
Latinos, mainly Mexican Americans, form major portions of the population of Southern California, especially in Los Angeles, as well as the San Joaquin Valley. The city of Los Angeles is often said to be the largest Mexican community in the United States. Census records kept track of the growth since 1850, but Mexicans and Mexican Americans have lived in California since Spanish colonial times. However, the number and percentage population of Latinos living in California increased rapidly in the late 20th century.
California also has the largest populations of Hispanics/Latinos in the country. Most of the state's Latinos have Mexican ancestry, having the largest Mexican population in the United States, making up about 31 percent of the state population. California has a large and diverse population, having the largest Central American, especially Salvadoran population in the United States. Guatemalan Americans are spread out in Southern California after previously being centered in Los Angeles between 1970 and 2010. California also has many Cuban Americans, Puerto Rican Americans, Honduran Americans, and Nicaraguan Americans, along with people of Chilean, Colombian, Peruvian, and other South American ancestry. Los Angeles has had the United States' largest Central American community, as well as the largest Mexican American community, since the 1910s. In fact, the 1900 census record finds 319 to 619 out of 100,000 residents in the city of Los Angeles were "Spanish" or "Mexican". Nearly 31% of Los Angeles itself is of Mexican descent, having the largest Mexican population of any city in the United States. 12,392 Belizeans also live in California.[56]
In Mariposa County, there is a very small community of Californios or Spanish American people as they identify themselves, that dates back before the U.S. annexation of California. Hornitos is home to an estimated 1,000 people and many have Spanish heritage. The community's "Spanish" Californio culture is closely linked with Mexico and other Latin American nations.
Middle Eastern Americans
Little Arabia is an ethnic enclave in Orange County, California,[57] the center for Orange County's Arab Americans, who number more than 24,000 (as of 2000).[58] It is sometimes referred to as "Little Gaza" which was a play on the original designation of this area as the "Garza Island."[59][60] Little Arabia grew significantly in the 1990s with the arrival of immigrants from the Middle East, and is the home to thousands of Arab Americans predominantly hailing from Egypt, Syria, Palestine, and Yemen.[61]
California is also home to many Armenian Americans; the highest concentration of Americans of Armenian descent is in the Greater Los Angeles area, where 166,498 people have identified themselves as Armenian in the 2000 U.S. census, comprising over 40% of the 385,488 people who identified Armenian origins in the U.S. at the time. Many of these live in Glendale north of Los Angeles, as well as a large community in Fresno. The size of the Armenian American population is disputed, however. According to a 1988 news article, California had about 500,000 ethnic Armenians with over half of them living in the Greater Los Angeles area.[63]
There is also large population of Assyrian descent living in the Central Valley, with large communities in Modesto, Ceres and Turlock, as well as throughout the Central Coast and the California Desert (i.e. the Coachella and Imperial valleys). San Diego has one of the largest concentrations of Chaldean immigrants in the United States.[69]
About an estimated 3,000 Moroccan Americans are living in Los Angeles, Long Beach, and Santa Ana.[70]
African Americans are approximately 7 percent of the state population. The state percentage of African Americans dropped in the 1990s and 2000s, though the state's overall number of African Americans has increased in that time period. The black population in East and West Oakland and South Central Los Angeles – places where they held the majority for decades – has greatly decreased as the black middle class has relocated to nearby suburbs, including those in the Inland Empire and Antelope Valley in Southern California and the Sacramento metropolitan area in Northern California.
As of 2010, California's Native American population of 362,801 was the most of any state.[75] It also has the most Native American tribes, indigenous to the state or not, but the majority of known Californian Indian tribes became extinct in the late 19th century. The U.S. census includes Latin American Indian, especially immigrants who belonged to indigenous peoples or who have Amerindian heritage from North and South America.
The Cherokee Nation is the largest tribe in the state with a population of 22,000 in 2020,[76] although the number of Cherokee descendants are at 110,000 in the earlier census taken in 2010 and any persons residing in California of Cherokee descent may surpass 600,000 according to demographers. Their tribal nation is in the northeast part of Oklahoma but they live across the state and neighboring states. They are often descendants of Dust Bowl refugees in the 1930s and 1940s who migrated to the state's farming counties and urban areas for jobs. The largest urban American Indian communities are Los Angeles/Long Beach, San Francisco/Oakland, Sacramento, and San Diego areas.[77]
The state has a long history of established East, South, and SoutheastAsian American communities, including Chinese since the 1850s, Japanese since the 1880s, Indians since the 1890s and Filipinos for over a century since 1900. A large wave of Asian immigration since 1965, following the Immigration and Nationality Act of 1965 which ended the ban on Asian immigration, brought in more Chinese along with Koreans and Southeast Asians after the Vietnam war ended in the late 1970s. South Asians are also a fast-growing group.
Southern California has perhaps the largest Taiwan-born Chinese American community in the U.S., particularly in the San Gabriel Valley (i.e. Walnut and Diamond Bar), Buena Park, Cerritos, West Covina, Irvine, communities in the South Bay, Los Angeles and southern Orange County. Many minority groups from China also live in California, for example, there are Tibetan and Mongolian Americans concentrated in San Francisco, Oakland, San Jose, Orange County, and the Los Angeles/Long Beach area.
Large Korean American communities exist in the Koreatown area of Los Angeles, the eastern San Gabriel Valley, the San Fernando Valley, Cerritos/Long Beach, South Bay, Los Angeles, northern Orange County and San Diego area. There is another large Korean American population in the San Francisco Bay Area, and Koreans are growing in number in the suburban Inland Empire region, in cities such as Chino Hills, Corona, Desert Hot Springs, and Loma Linda south of San Bernardino. Since 1990, the Korean American and African American populations relocated westward and northward in the Los Angeles area.
California has the largest Indian American population in the U.S. Many live in the Los Angeles Metropolitan Area, San Diego, and the San Francisco Bay Area. The Los Angeles suburbs of Artesia and Cerritos have large Indian American communities. San Jose, Fremont, and other Silicon Valley cities have many Indian Americans who are employed in the high-tech industry. Many Indian Americans are in Central Valley cities such as Stockton, Bakersfield, Fresno, Yuba City, and the Imperial Valley. Most South Asians in California are Indian American, but there are also Pakistani Americans, Bangladeshi Americans, and Sri Lankan Americans (see Sinhalese and Tamils) esp. concentrated in the San Gabriel Valley (Covina Valley) of the Los Angeles area. California is home to the unique Punjabi Mexican American community, mostly centered around Yuba City.
Southeast Asian Americans
California has the largest American population of Southeast Asians, concentrated in the Los Angeles-Long Beach, Sacramento, and Fresno areas. This includes the Hmong and Vietnamese, including Chinese Vietnamese. Long Beach has one of the largest Cambodian American communities in the United States. The neighboring cities of Westminster and Garden Grove have the largest Vietnamese American community outside of Vietnam and are often dubbed "Little Saigon". Vietnamese and Cambodian immigrants also settled in the San Francisco Bay Area, especially San Jose, Santa Clara and Sunnyvale, as well across the San Joaquin Valley and in San Diego.
Over 6,000 Laotian Americans live in the Fresno area, including an even larger Hmong American community, the second-largest of its kind. Other Hmong colonies in the Central Valley of California and Northern California developed since the end of the Vietnam war (1975–79).
California also has a Thai American community of over 250,000, concentrated in Southern California, with small Thai and Southeast Asian communities in Perris and Banning in the Inland Empire region. Los Angeles has the largest Thai population outside of Thailand and is also home to the world's first Thai Town. About 150,000 Indonesians live in Southern California, primarily the Los Angeles and San Diego areas.
There are also many Palauan Americans in southern California, specifically in the San Diego area. This includes Vista which has a population of 677 Palauan Americans according to the 2010 U.S. census. Members of the Palauan community often also have Malay, Indonesian, Micronesian, Melanesian, Japanese, and other East Asian ancestries. Many Chuukese or Trukese live in San Diego.
Comparatively, according to the 2007 American Community Survey, 42.6 percent of California's population older than five spoke a language other than English at home, with 73 percent of those also speaking English well or very well, while 9.8 did not speak English at all.[102]
California had the highest concentration of Vietnamese or Chinese speakers in the United States, second highest concentration of Korean or Spanish speakers in the United States, and third highest concentration of Tagalog speakers in the United States.[102] California was historically one of the most linguistically diverse areas in the world, and is home to more than 70 indigenous languages derived from 64 root languages in 6 language families.[103][104] A survey conducted between 2007 and 2009 identified 23 different indigenous languages of Mexico that are spoken among California farmworkers.[105]
Over 200 languages are known to be spoken and read in California, with Spanish used as the state's "alternative" language. California has more than 100 indigenous languages, making California one of the most linguistically diverse areas in the world. All of California's indigenous languages are endangered, although there are now efforts toward language revitalization.[note 1]
The official language of California has been English since the passage of Proposition 63 in 1986.[106] However, many state, city, and local government agencies still continue to print official public documents in numerous languages.[107] For example, the California Department of Motor Vehicles offers the written exam for the standard C Class driver's license in 31 languages along with English, and the audio exam in 11 languages.[108] The politics of language is a major political issue in the state, especially in regard to language policy controlling the teaching and official use of immigrant languages.
As a result of the state's increasing diversity and migration from other areas across the country and around the globe, linguists began noticing a noteworthy set of emerging characteristics of spoken English in California since the late 20th century. This dialect, known as California English, has a vowel shift and several other phonological processes that are different from the dialects used in other regions of the country.[109]
California also has large Muslim communities in west Los Angeles, San Diego, Beverly Hills, Orange County, Santa Clara County, and the Modesto area.
Most Catholics in California are of Mexican, Central American, Irish, German, Italian, Vietnamese, Filipino, and Korean ancestry. The population of Catholic Californians is rapidly growing due to the influx of Latin American, Asian, African, and Middle Eastern Christian immigrants. In the Archdiocese of Los Angeles, Sunday Mass is celebrated in 42 different languages representing more than 30 ethnic groups from around the world.[113] The Catholic dioceses of Orange, Los Angeles and San Jose have the largest Catholic diaspora of Vietnamese Catholics in world outside of Vietnam, estimated to be about 250,000-300,000 Catholics out of a total Vietnamese California population of 1.3 Million.[114]
The largest Christian denominations in California in 2000 were the Catholic Church with 10,079,310; the Church of Jesus Christ of Latter-day Saints with 529,575; and the Southern Baptist Convention with 471,119. Jewish congregations had 994,000 adherents, or 3% of the Californian population.[115]
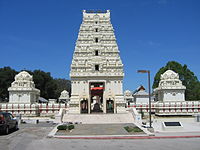
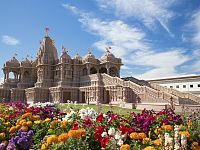
California has the highest Hindu population in the United States,[117] most of them Indian Americans.[118] Many of the prominent Hindu temples including the Malibu Hindu Temple are located in California.
California also has the largest Muslim community in the United States, an estimated one percent of the population, mostly residing in Southern California. Approximately 100,000 Muslims reside in San Diego.[122]
California has more members of The Church of Jesus Christ of Latter-day Saints and Temples than any state except Utah.[123]Latter-day Saints (Mormons) have played important roles in the settlement of California throughout the state's history. For example, a group of a few hundred Latter-day Saint converts from the Northeastern United States and Europe arrived at what would become San Francisco in the 1840s aboard the ship Brooklyn, more than doubling the population of the small town. A group of Latter-day Saints also established the city of San Bernardino in Southern California in 1851.[111] According to the LDS Church 2014 statistics, 780,200 Latter-day Saints reside in the state of California, attending almost 1400 congregations statewide.[111]
The Seventh-day Adventist Church is headquartered in Loma Linda in San Bernardino county 60 miles east of Los Angeles, where the church members form the majority of the town's population. The SDA church there has a university, a free hospital and a TV station (3ABN or the 3 Angels Broadcasting Network). The town is known for a large number of centenarians.[124]
A Pew Research Center survey revealed, however, that California is less religious than the rest of the United States: 62% of Californians say they are "absolutely certain" of the belief "in God or a universal spirit", while in the nation 71% say so. The survey also revealed that 48% of Californians say religion is "very important", while the figure for the U.S. in general is 56%.[125]
California's income distribution is quite broad compared to the country's as a whole; its proportions of residents with no income and of residents with income over $100,000 are both higher than the national average. This broad distribution combined with high housing and living costs give California an abnormally high poverty rate. The Census Bureau's Supplemental Poverty Measure, calculated by comparing household income to a locally-adjusted poverty threshold, reports that 20.7% of California's population has income insufficient for their basic needs, as compared to 12.9% for the U.S. as a whole.[127] This calculation of income includes the benefits of California welfare programs such as food stamps and earned income tax credits — without these, the state's poverty rate would be 28%.[128]
A comparison of the distributions of California (left) and U.S. (right) households by their income relative to their estimated cost of living, showing the higher rates of poverty and near-poverty in California. Uses 2017 CPS data about incomes in 2016. Comparison is of NAS Family Income minus Medical Out-of-Pocket to CE-Based Poverty Threshold with CPI-U and Geographical Price Adjustments, as per .
The trends of low income in California are complex; from 1975 to 2014, real (inflation-adjusted) incomes have alternated between rises and sharp declines. These incomes have decreased overall for those outside the top 20th percentile, with the bottom 20th percentile seeing an average decline of 1% per year during that period.[129][130] Correspondingly, the percent of Californians with income below their poverty threshold has risen and fallen, but has on average increased by a tenth of a percentage point per year.[131]
Increasing income inequality has had many effects on Californians' lives, including on life expectancy, which can be taken as a proxy for health or even general welfare. A study conducted by Clarke et al.[132] related life expectancy to socioeconomic status (SES, an index including income and other related factors), finding that Californians in the top 20% by SES live on average six years longer than those in the bottom 20% (81 years, compared to 75). This disparity becomes even more pronounced when intersected with race: White males in the top 20% live 14 years longer than African American males in the bottom 20% (for females, the difference is 10 years).[132]
The complexity of the state's low-income trends were visible when, in response to growing Chinese and Spanish-speaking populations, the city of Oakland implemented the nation's first policy of recruiting bilingual applicants for public-facing city jobs in 2001. This increased the employment of Hispanic and Chinese bilinguals throughout the public workforce, but also lowered (monolingual) Black employment.[133]
↑ The following are a list of the indigenous languages: Root languages of California: Athabaskan Family: Hupa, Mattole, Lassik, Wailaki, Sinkyone, Cahto, Tolowa, Nongatl, Wiyot, Chilula; Hokan Family: Pomo, Shasta, Karok, Chimiriko; Algonquian Family: Whilkut, Yurok; Yukian Family: Wappo; Penutian Family: Modok, Wintu, Nomlaki, Konkow, Maidu, Patwin, Nisenan, Miwok, Coast Miwok, Lake Miwok, Ohlone, Northern Valley Yokuts, Southern Valley Yokuts, Foothill Yokuts; Hokan Family: Esselen, Salinan, Chumash, Ipai, Tipai, Yuma, Halchichoma, Mohave; Uto-Aztecan Family: Mono Paiute, Monache, Owens Valley Paiute, Tubatulabal, Panamint Shoshone, Kawaisu, Kitanemuk, Tataviam, Gabrielino, Juaneno, Luiseno, Cuipeno, Cahuilla, Serrano, Chemehuevi
Related Research Articles
California is a state in the Western United States, lying on the American Pacific Coast. It borders Oregon to the north, Nevada and Arizona to the east, and the Mexican state of Baja California to the south. With over 38.9million residents across a total area of approximately 163,696 square miles (423,970 km2), it is the most populous U.S. state, the third-largest U.S. state by area, and the most populated subnational entity in North America.
Santa Ana is a city in and the county seat of Orange County, California, United States. Located in the Greater Los Angeles region of Southern California, the city's population was 310,227 at the 2020 census, making Santa Ana the second most populous city in Orange County, the 13th-most populous city in California, and the 64th densest large city in the United States. Santa Ana is a major regional economic and cultural hub for the Orange Coast.
Los Angeles County, officially the County of Los Angeles, and sometimes abbreviated as L.A. County, is the most populous county in the United States, with 9,861,224 residents estimated in 2022. Its population is greater than that of 40 individual U.S. states. Comprising 88 incorporated cities and many unincorporated areas within a total area of 4,083 square miles (10,570 km2), it is home to more than a quarter of Californians and is one of the most ethnically diverse U.S. counties. The county's seat, Los Angeles, is the second most populous city in the United States and the most populous city in California, with 3,822,238 residents estimated in 2022. It is also known for being the home of the American film and television industry, a distinction it has held since the early 20th century which has given the county global prominence.
Alameda County is a county located in the U.S. state of California. As of the 2020 census, the population was 1,682,353, making it the 7th-most populous county in the state and 21st most populous nationally. The county seat is Oakland. Alameda County is in the San Francisco Bay Area, occupying much of the East Bay region.
Inyo County is a county in the eastern central part of the U.S. state of California, located between the Sierra Nevada and the state of Nevada. In the 2020 census, the population was 19,016. The county seat is Independence. Inyo County is on the east side of the Sierra Nevada and southeast of Yosemite National Park in Central California. It contains the Owens River Valley; it is flanked to the west by the Sierra Nevada and to the east by the White Mountains and the Inyo Mountains. With an area of 10,192 square miles (26,400 km2), Inyo is the second-largest county by area in California, after San Bernardino County. Almost one-half of that area is within Death Valley National Park. However, with a population density of 1.8 people per square mile, it also has the second-lowest population density in California, after Alpine County.
San Bernardino County, officially the County of San Bernardino, is a county located in the southern portion of the U.S. state of California, and is located within the Inland Empire area. As of the 2020 U.S. Census, the population was 2,181,654, making it the fifth-most populous county in California and the 14th-most populous in the United States. The county seat is San Bernardino.
Greater Los Angeles is the most populous metropolitan area in the U.S. state of California, encompassing five counties in Southern California extending from Ventura County in the west to San Bernardino County and Riverside County in the east, with Los Angeles County in the center, and Orange County to the southeast. The Los Angeles–Anaheim–Riverside combined statistical area (CSA) covers 33,954 square miles (87,940 km2), making it the largest metropolitan region in the United States by land area. The contiguous urban area is 2,281 square miles (5,910 km2), whereas the remainder mostly consists of mountain and desert areas. With a population of 20.6 million in 2023, it is the second-largest metropolitan area in the country, behind New York, as well as one of the largest megacities in the world.
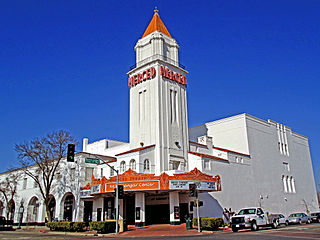
Merced County, is a county located in the northern San Joaquin Valley section of the Central Valley, in the U.S. state of California.
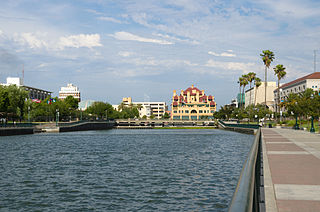
San Joaquin County, officially the County of San Joaquin, is a county located in the U.S. state of California. As of the 2020 census, the population was 779,233. The county seat is Stockton.
Alhambra is a city located in the western San Gabriel Valley region of Los Angeles County, California, United States, approximately eight miles from the Downtown Los Angeles civic center. It was incorporated on July 11, 1903. As of the 2020 census, the population was 82,868. The city's ZIP Codes are 91801 and 91803.
Chino is a city in the western end of San Bernardino County, California, United States, with Los Angeles County to its west and Orange County to its south in the Southern California region.
Chula Vista is a city in San Diego County, California, United States. It is also the second-largest city in the San Diego metropolitan area, the seventh largest city in Southern California, the fifteenth largest city in the state of California, and the 78th-largest city in the United States. The population was 275,487 as of the 2020 census, up from 243,916 as of the 2010 census. Located about halfway—7.5 miles (12.1 km)—between the two downtowns of San Diego and Tijuana in the South Bay, the city is at the center of one of the richest culturally diverse zones in the United States. Chula Vista is so named because of its scenic location between the San Diego Bay and coastal mountain foothills.
Mexican Americans are Americans of Mexican heritage. In 2022, Mexican Americans comprised 11.2% of the US population and 58.9% of all Hispanic and Latino Americans. In 2019, 71% of Mexican Americans were born in the United States; they make up 53% of the total population of foreign-born Hispanic Americans and 25% of the total foreign-born population. Chicano is a term used by some to describe the unique identity held by Mexican-Americans. The United States is home to the second-largest Mexican community in the world, behind only Mexico. Most Mexican Americans reside in the Southwest, with over 60% of Mexican Americans living in the states of California and Texas.
The demographics of Los Angeles are determined by population surveys such as the American Community Survey and the United States Census. According to U.S. Census Bureau estimates, Los Angeles' population was 3,979,576 in 2019.
Riverside County is a county located in the southern portion of the U.S. state of California. As of the 2020 census, the population was 2,418,185, making it the fourth-most populous county in California and the 10th-most populous in the United States. The name was derived from the city of Riverside, which is the county seat.
San Diego County, officially the County of San Diego, is a county in the southwestern corner of the U.S. state of California. As of the 2020 census, the population was 3,298,634, making it California's second-most populous county and the fifth-most populous in the United States. Its county seat is San Diego, the second-most populous city in California and the eighth-most populous city in the United States. It is the southwesternmost county in the 48 contiguous United States, and is a border county. It is also home to 18 Native American tribal reservations, the most of any county in the United States.
Hispanic and Latino Californians are residents of the state of California who are of Hispanic or Latino ancestry. As of the 2020 U.S. Census, Hispanics and Latinos of any race were 39.4% of the state's population, making it the largest ethnicity in California.
African American Californians, or Black Californians are residents of the state of California who are of African ancestry. According to 2019 United States Census Bureau estimates, those identified solely as African American or black constituted 5.8% or 2,282,144 residents in California. Including an additional 1.2% who identified as having partial African ancestry, the figure was 7.0%. As of 2021, California has the largest multiracial African American population by number in the United States. African Americans are the fourth largest ethnic group in California after Hispanics, white people, and Asians. Asians outnumbered African Americans in the 1980s.
Hispanic and Latino Nevadans are residents of the state of Nevada who are of Hispanic or Latino ancestry. As of the 2020 U.S. Census, Hispanics and Latinos of any race were 28.3% of the state's population.
White Californians are White Americans living in California who currently comprise 41.2% of the state's population according to the official 2020 census.
↑ Full parameter set in horizontal format.Hill, Laura E.; Johnson, Hans P; Ezekiel, David; Hayes, Joseph M. (July 2011). "Silicon Valley Community Foundation". Unauthorized Immigrants in California(PDF) (Report). Public Policy Institute of California. Retrieved June 26, 2018.
↑ "Archived copy". italoamericano.org. Archived from the original on March 27, 2015. Retrieved January 15, 2022.{{cite web}}: CS1 maint: archived copy as title (link)
↑ Brown, Aldrin (25 October 2001) "Anaheim's Muslim community sees spike in suspected hate crimes" The Orange County Register p. 1
↑ Flaccus, Gillian (10 October 2006) "Anaheim city council race heats up as GOP leader accuses candidate of pro-Hezbollah activities" from The Associated Press
↑ Associated Press (13 September 2004) "News briefs from around Southern California: Anaheim City Officials are Investigating Complaints"
↑ Carter, Chelsea J. (16 March 2002) "Arabs, Jews in U.S. express frustration over conflict" The New Mexican (Santa Fe, NM) p. D-1, D-3, from The Associated Press
↑ Karen R. Humes; Nicholas A. Jones; Roberto R. Ramirez (March 2011). "Overview of Race and Hispanic Origin: 2010"(PDF). United States Census Bureau. U.S. Department of Commerce. Retrieved January 5, 2012.
↑ "Total Ancestry Reported". 2009–2013 American Community Survey 5-Year Estimates. United States Census Bureau. 2013. Archived from the original on December 27, 2014. Retrieved January 1, 2015.
1 2 Hyon B. Shin; Robert A. Kominski (April 2010). "Language Use in the United States: 2007"(PDF). United States Census Bureau. United States Department of Commerce. Retrieved May 27, 2013.
↑ Wesson, Herb (July 17, 2001). "AB 800 Assembly Bill – Bill Analysis". California State Assembly. p.3. Archived from the original on November 23, 2010. Retrieved December 27, 2009. In 1986, California voters amended the state constitution to provide that the: The [sic] Legislature and officials of the State of California shall take all steps necessary to insure that the role of English as the common language of the State of California is preserved and enhanced. The Legislature shall make no law which diminishes or ignores the role of English as the common language of California."
↑ Hull, Dana (May 20, 2006). "English already is "official" in California". San Jose Mercury News. San Jose, California: MediaNews Group. English has been the "official" language of California since 1986, when voters passed Proposition 63. You'd barely know it. The Santa Clara County Registrar of Voters prints ballots in English, Spanish, Vietnamese, Chinese and Tagalog. California drivers can take the written license exam in 31 languages, from Amharic, which is spoken in Ethiopia, to Thai. You can view the state's online Megan's Law database of registered sex offenders in Portuguese or Punjabi. [..] Proposition 63, which received 73 percent of the vote in 1986, was largely symbolic, sending a message to immigrants that they should learn to speak English if they expected to live in California. The measure directed the state to "preserve, protect and strengthen the English language," but did not call for any specific action or enforcement. Twenty-six other states have official-English laws on the books.
↑ Melton, J. Gordon, ed. (December 2002). "Eastern Family Part II: Buddhism, Shintoism, Japanese New Religions". Encyclopedia of American Religions (Seventhed.). Detroit: Gale Cengage. pp.201–211. ISBN978-0-7876-6384-1. OCLC51255717.
↑ BECERRA, HECTOR (July 4, 2014). "Repair work set to begin at neglected Jewish cemetery". Los Angeles Times. Rabbi Moshe Greenwald, co-director of Chabad of Downtown Los Angeles -- which has led the effort to restore Mount Zion -- said he hopes $700,000 can be raised to properly repair the cemetery, though there would be other ongoing costs after that. Greenwald said several people came forward to help, including businesspeople and real estate developers who gave donations. He said he even got a call from the L.A. Archdiocese, and that he hopes to speak to local church leaders to get the word out about the problem of vandalism.
↑ Posner, Menachem. "300 Rabbinical Students Heading Out for Summer Sojourns". Lubavitch World Headquarters. Chabad.org is a division of the Chabad-Lubavitch Media Center. Zarchi was followed by Rabbi Efraim Mintz, who served as a Roving Rabbi in California in 1990. Mintz, who directs the Rohr Jewish Learning Institute, shared tips and advice on honing a Torah "elevator pitch," as well as ideas about presenting more advanced Torah thoughts on a variety of subjects to share with others during the course of their travels. Fishkoff, Sue (March 3, 2006). "That's Growth!". SAN RAFAEL, California: JTA. Shturem.net. Leading the class was Chabad Rabbi Yisrael Rice...Rice, chairman of the Rohr Jewish Learning Institute's editorial board, asks members of the group why they're there. Fishkoff, Sue (March 2, 2006). "Chabad institute keeps on growing". SAN RAFAEL, California. Jewish Telegraphic Agency. Rice, chairman of the Rohr Jewish Learning Institute's editorial board, asks members of the group why they're there. "I'm trying to put some things together," one man says. "I'm trying to fix a broken link," the women next to him says. "Where am I going? God willing, I'm going closer," the next woman says. Billed as a mystical approach to the concepts of time and the Jewish calendar, The Kabbalah of Time is the 14th course in adult Jewish literacy offered by JLI, a seven-year-old project of the Chabad-Lubavitch movement.
↑ "Home". Muslim Community Center of Greater San Diego. Retrieved September 8, 2021.
This page is based on this Wikipedia article Text is available under the CC BY-SA 4.0 license; additional terms may apply. Images, videos and audio are available under their respective licenses.