
Hydroelectricity, or hydroelectric power, is electricity generated from hydropower. Hydropower supplies one sixth of the world's electricity, almost 4,500 TWh in 2020, which is more than all other renewable sources combined and also more than nuclear power. Hydropower can provide large amounts of low-carbon electricity on demand, making it a key element for creating secure and clean electricity supply systems. A hydroelectric power station that has a dam and reservoir is a flexible source, since the amount of electricity produced can be increased or decreased in seconds or minutes in response to varying electricity demand. Once a hydroelectric complex is constructed, it produces no direct waste, and almost always emits considerably less greenhouse gas than fossil fuel-powered energy plants. However, when constructed in lowland rainforest areas, where part of the forest is inundated, substantial amounts of greenhouse gases may be emitted.
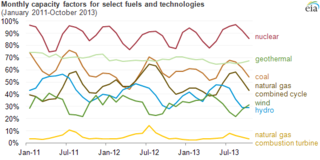
The net capacity factor is the unitless ratio of actual electrical energy output over a given period of time to the theoretical maximum electrical energy output over that period. The theoretical maximum energy output of a given installation is defined as that due to its continuous operation at full nameplate capacity over the relevant period. The capacity factor can be calculated for any electricity producing installation, such as a fuel consuming power plant or one using renewable energy, such as wind, the sun or hydro-electric installations. The average capacity factor can also be defined for any class of such installations, and can be used to compare different types of electricity production.

Energy in the United States is obtained from a diverse portfolio of sources, although the majority came from fossil fuels in 2021, as 36% of the nation's energy originated from petroleum, 32% from natural gas, and 11% from coal. Electricity from nuclear power supplied 8% and renewable energy supplied 12%, which includes biomass, wind, hydro, solar and geothermal.

Brazil is the 7th largest energy consumer in the world and the largest in South America. At the same time, it is an important oil and gas producer in the region and the world's second largest ethanol fuel producer. The government agencies responsible for energy policy are the Ministry of Mines and Energy (MME), the National Council for Energy Policy (CNPE), the National Agency of Petroleum, Natural Gas and Biofuels (ANP) and the National Agency of Electricity (ANEEL). State-owned companies Petrobras and Eletrobras are the major players in Brazil's energy sector, as well as Latin America's.

Wind power in Texas, a portion of total energy in Texas, consists of over 150 wind farms, which together have a total nameplate capacity of over 30,000 MW. If Texas were a country, it would rank fifth in the world: The installed wind capacity in Texas exceeds installed wind capacity in all countries but China, the United States, Germany and India. Texas produces the most wind power of any U.S. state. According to the Electric Reliability Council of Texas (ERCOT), wind power accounted for at least 15.7% of the electricity generated in Texas during 2017, as wind was 17.4% of electricity generated in ERCOT, which manages 90% of Texas's power. ERCOT set a new wind output record of nearly 19.7 GW at 7:19 pm Central Standard Time on Monday, January 21, 2019.
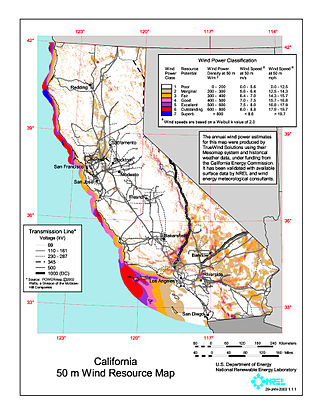
Wind power in California had initiative and early development during Governor Jerry Brown's first two terms in the late 1970s and early 1980s. The state's wind power capacity has grown by nearly 350% since 2001, when it was less than 1,700 MW. In 2016, wind energy supplied about 6.9% of California's total electricity needs, or enough to power more than 1.3 million households. Most of California's wind generation is found in the Tehachapi area of Kern County, California, with some large projects in Solano, Contra Costa and Riverside counties as well. California is among the states with the largest amount of installed wind power capacity. In recent years, California has lagged behind other states when it comes to the installation of wind power. It was ranked 4th overall for wind power electrical generation at the end of 2016 behind Texas, Iowa, and Oklahoma. As of 2019, California had 5,973 megawatts (MW) of wind power generating capacity installed.

According to data from the US Energy Information Administration, renewable energy accounted for 8.4% of total primary energy production and 21% of total utility-scale electricity generation in the United States in 2022.
Romania is the 38th largest energy consumer in the world and the largest in South Eastern Europe as well as an important producer of natural gas, oil and coal in Europe.

At the end of 2015, the installed capacity of wind power in Washington was 3,075 megawatts (MW) with wind power accounting for 7,101 GWh. In 2016, it reached a generation of 8,041 GWh, comprising 7.1% of the electricity generated in the state. In 2023, it had a capacity of 3,407 MW, responsible for 7.75% of generation.

At the end of 2016, the installed capacity for wind power in Minnesota was 3,500 megawatts (MW). Wind power generated nearly 18 percent of Minnesota’s electricity in 2016, ranking sixth in the nation for wind energy as a share of total electricity generation.

India is the world's 4th largest consumer of electricity and the world's 3rd largest renewable energy producer with 40% of energy capacity installed in the year 2022 coming from renewable sources. Ernst & Young's (EY) 2021 Renewable Energy Country Attractiveness Index (RECAI) ranked India 3rd behind USA and China. In FY2023-24, India is planning to issue 50 GW tenders for wind, solar and hybrid projects. India has committed for a goal of 500 GW renewable energy capacity by 2030. In line with this commitment, India's installed renewable energy capacity has been experiencing a steady upward trend. From 94.4 GW in 2021, the capacity has gone up to 119.1 GW in 2023 as of Q4.

Wind power in Illinois provided nearly 10% of the state's generated electrical power in 2020 powering 1,231,900 homes. At the end of 2020, Illinois had 6,300 megawatts (MW) of wind power installed, ranking fifth among states for installed wind turbine capacity. An additional 1,100 MW of wind power was under construction across the state at the end of 2020.
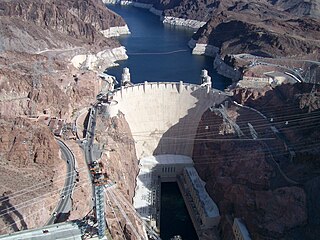
Hydroelectricity is, as of 2019, the second-largest renewable source of energy in both generation and nominal capacity in the United States. In 2021, hydroelectric power produced 31.5% of the total renewable electricity, and 6.3% of the total U.S. electricity.
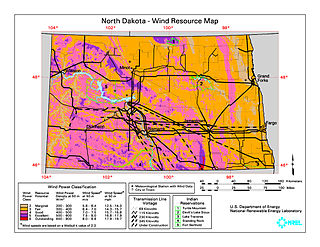
North Dakota is a leading U.S. state in wind power generation. The state generated 26.8% of its electricity from wind during year 2017, enough to power over one million homes.

The state of South Dakota is a leader in the U.S. in wind power generation with over 30% of the state's electricity generation coming from wind in 2017. In 2016, South Dakota had 583 turbines with a total capacity of 977 megawatts (MW) of wind generation capacity. In 2019, the capacity increased to 1525 MW.

The U.S. State of Oklahoma has high potential capacity for wind power in the western half of the state. In 2021, Oklahoma's installed wind generation capacity was almost 10,500 megawatts, supplying over 40% of the state's generated electricity and 85% of Oklahoma's total generating capacity from all renewable resources.
Iowa is one of the largest states by electric production and the largest one that does not produce petroleum. In 2021, Iowa had a total summer capacity of 21,771 MW through all of its power plants, and in 2022 Iowa had a net generation of 71,316 gigawatt-hours. The corresponding electrical energy generation mix was 62.4% wind, 25.4% coal, 9.2% natural gas, 1.6% hydroelectric, 1% solar, 0.2% petroleum and 0.3% biomass. Small-scale solar, which includes customer-owned photovoltaic panels, delivered 308 GWh to the state's electrical grid.


