1951 USAF resolution test chart

Last updated
Glass chart 1951usaf test target.jpg
Glass chart

A 1951 USAF resolution test chart is a microscopic optical resolution test device originally defined by the U.S. Air Force MIL-STD-150A standard of 1951. The design provides numerous small target shapes exhibiting a stepped assortment of precise spatial frequency specimens. It is widely used in optical engineering laboratory work to analyze and validate imaging systems such as microscopes, cameras and image scanners. [1]

Contents

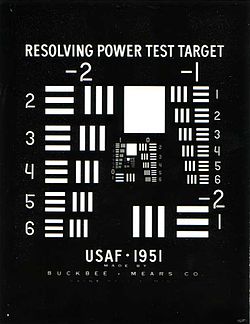
The full standard pattern consists of 9 groups, with each group consisting of 6 elements; thus there are 54 target elements provided in the full series. Each element consists of three bars which form a minimal Ronchi ruling. These 54 elements are provided in a standardized series of logarithmic steps in the spatial frequency range from 0.250 to 912.3 line pairs per millimeter (lp/mm). The series of elements spans the range of resolution of the unaided eye, down to the diffraction limits of conventional light microscopy.

Commercially produced devices typically consist of a transparent square glass slide, 2 inches or 50 mm in dimension. The slide is printed in metallic chromium by photolithography with the standard pattern, photographically reduced from a large master plot. Slides are available as photographic positive or negative prints to best fit the illumination technique used in various testing methods. A less expensive, abbreviated version omits the two tiniest groups at the center of the pattern (groups number 8 and 9), since the lithography at that scale is costly, and the group elements represent resolution beyond the design of many imaging applications.

In practice, the spatial resolution of an imaging system is measured by simply inspecting the system's image of the slide. The largest element observed without distinct image contrast indicates the approximate resolution limit.[ citation needed ] This element's label is noted by the observer (each group, and each element within a group, is labeled with a single digit). This pair of digits indicates a given element's row and column location in the series table, which in turn defines the spatial frequency of each element, and thus the available resolution of the system.

An analytical characterization of resolution as the modulation transfer function is available by plotting the observed image contrast as a function of the various element spatial frequencies. Optical aberrations in the imaging system are readily detected and characterized by translating and rotating the elements within the imaging system's field of view.

Pattern format

The common MIL-STD-150A format consists of six groups in a compact spiral arrangement of three layers. The largest two groups, forming the first layer, are located on the outer sides. The smaller layers consist of repeating progressively smaller pairs toward the center. Each group consists of six elements, numbered from 1 to 6. Within the same layer, the odd-numbered groups appear contiguously from 1 through 6 from the upper right corner. The first element of the even-numbered groups is at the lower right of the layer, with the remaining 2 through 6, at the left. The scales and dimensions of the bars are given by the expression

although usually the following lookup table will be more convenient to use. The line pair (lp) means a black and a white line.

Number of line pairs per millimeter in USAF Resolving Power Test Target 1951
Group number
Element−2−10123456789
10.2500.5001.002.004.008.0016.0032.064.0128.0256.0512.0
20.2810.5611.122.244.498.9817.9635.971.8143.7287.4574.7
30.3150.6301.262.525.0410.0820.1640.380.6161.3322.5645.1
40.3540.7071.412.835.6611.3122.6345.390.5181.0362.0724.1
50.3970.7941.593.176.3512.7025.4050.8101.6203.2406.4812.7
60.4450.8911.783.567.1314.2528.5157.0114.0228.1456.1912.3


Width of a line in micrometers in USAF Resolving Power Test Target 1951
Group number
Element−2−10123456789
12000.001000.00500.00250.00125.0062.5031.2515.637.813.911.950.98
21781.80890.90445.45222.72111.3655.6827.8413.926.963.481.740.87
31587.40793.70396.85198.4399.2149.6124.8012.406.203.101.550.78
41414.21707.11353.55176.7888.3944.1922.1011.055.522.761.380.69
51259.92629.96314.98157.4978.7539.3719.699.844.922.461.230.62
61122.46561.23280.62140.3170.1535.0817.548.774.382.191.100.55

Images

See also

Related Research Articles

Log-periodic antenna Multi-element, directional antenna useable over a wide band of frequencies

A log-periodic antenna (LP), also known as a log-periodic array or log-periodic aerial, is a multi-element, directional antenna designed to operate over a wide band of frequencies. It was invented by John Dunlavy in 1952.

Interferometry Measurement method using interference of waves

Interferometry is a technique which uses the interference of superimposed waves to extract information. Interferometry typically uses electromagnetic waves and is an important investigative technique in the fields of astronomy, fiber optics, engineering metrology, optical metrology, oceanography, seismology, spectroscopy, quantum mechanics, nuclear and particle physics, plasma physics, remote sensing, biomolecular interactions, surface profiling, microfluidics, mechanical stress/strain measurement, velocimetry, optometry, and making holograms.

Camera lens Optical lens or assembly of lenses used with a camera to create images

A camera lens is an optical lens or assembly of lenses used in conjunction with a camera body and mechanism to make images of objects either on photographic film or on other media capable of storing an image chemically or electronically.

The Foveon X3 sensor is a digital camera image sensor designed by Foveon, Inc., and manufactured by Dongbu Electronics. It uses an array of photosites that consist of three vertically stacked photodiodes. Each of the three stacked photodiodes has a different spectral sensitivity, allowing it to respond differently to different wavelengths. The signals from the three photodiodes are then processed as additive color data that are transformed to a standard RGB color space.

Synthetic-aperture radar Form of radar used to create images of landscapes

Synthetic-aperture radar (SAR) is a form of radar that is used to create two-dimensional images or three-dimensional reconstructions of objects, such as landscapes. SAR uses the motion of the radar antenna over a target region to provide finer spatial resolution than conventional stationary beam-scanning radars. SAR is typically mounted on a moving platform, such as an aircraft or spacecraft, and has its origins in an advanced form of side looking airborne radar (SLAR). The distance the SAR device travels over a target during the period when the target scene is illuminated creates the large synthetic antenna aperture. Typically, the larger the aperture, the higher the image resolution will be, regardless of whether the aperture is physical or synthetic – this allows SAR to create high-resolution images with comparatively small physical antennas. For a fixed antenna size and orientation, objects which are further away remain illuminated longer - therefore SAR has the property of creating larger synthetic apertures for more distant objects, which results in a consistent spatial resolution over a range of viewing distances.

Visual acuity Clarity of vision

Visual acuity (VA) commonly refers to the clarity of vision, but technically rates an examinee's ability to recognize small details with precision. Visual acuity is dependent on optical and neural factors, i.e. (1) the sharpness of the retinal image within the eye, (2) the health and functioning of the retina, and (3) the sensitivity of the interpretative faculty of the brain. The most commonly referred visual acuity is the far acuity, which describes the examinee's ability to recognize small details at a far distance, and is relevant to people with myopia; however, for people with hyperopia, the near acuity is used instead to describe the examinee's ability to recognize small details at a near distance.

Telescopic sight Sighting device for firearms

A telescopic sight, commonly called a scope informally, is an optical sighting device based on a refracting telescope. It is equipped with some form of a referencing pattern – known as a reticle – mounted in a focally appropriate position in its optical system to provide an accurate point of aim. Telescopic sights are used with all types of systems that require magnification in addition to reliable visual aiming, as opposed to non-magnifying iron sights, reflector (reflex) sights, holographic sights or laser sights, and are most commonly found on long-barrel firearms, particularly rifles, usually via a scope mount. The optical components may be combined with optoelectronics to form a digital night scope or a "smart scope".

A collimator is a device which narrows a beam of particles or waves. To narrow can mean either to cause the directions of motion to become more aligned in a specific direction, or to cause the spatial cross section of the beam to become smaller.

Image resolution is the detail an image holds. The term applies to digital images, film images, and other types of images. "Higher resolution" means more image detail.

Super-resolution imaging (SR) is a class of techniques that enhance (increase) the resolution of an imaging system. In optical SR the diffraction limit of systems is transcended, while in geometrical SR the resolution of digital imaging sensors is enhanced.

Optical resolution describes the ability of an imaging system to resolve detail, in the object that is being imaged.

A superlens, or super lens, is a lens which uses metamaterials to go beyond the diffraction limit. For example, in 1995, Guerra combined a transparent grating having 50nm lines and spaces with a conventional microscope immersion objective. The resulting "superlens" resolved a silicon sample also having 50nm lines and spaces, far beyond the classical diffraction limit imposed by the illumination having 650nm wavelength in air. The diffraction limit is a feature of conventional lenses and microscopes that limits the fineness of their resolution depending on the illumination wavelength and the numerical aperture NA of the objective lens. Many lens designs have been proposed that go beyond the diffraction limit in some way, but constraints and obstacles face each of them.

Minimum resolvable temperature difference (MRTD) is a measure for assessing the performance of infrared cameras, and is inversely proportional to the modulation transfer function.

Optical transfer function Function that specifies how different spatial frequencies are handled by an optical system

The optical transfer function (OTF) of an optical system such as a camera, microscope, human eye, or projector specifies how different spatial frequencies are handled by the system. It is used by optical engineers to describe how the optics project light from the object or scene onto a photographic film, detector array, retina, screen, or simply the next item in the optical transmission chain. A variant, the modulation transfer function (MTF), neglects phase effects, but is equivalent to the OTF in many situations.

MIL-STD-1760 Aircraft/Store Electrical Interconnection System defines a standardized electrical interface between a military aircraft and its carriage stores. Carriage stores range from weapons, such as GBU-31 JDAM, to pods, such as AN/AAQ-14 LANTIRN, to drop tanks. Prior to adoption and widespread use of MIL-STD-1760, new store types were added to aircraft using dissimilar, proprietary interfaces. This greatly complicated the aircraft equipment used to control and monitor the store while it was attached to the aircraft: the stores management system, or SMS.

Scanning acoustic microscope

A scanning acoustic microscope (SAM) is a device which uses focused sound to investigate, measure, or image an object. It is commonly used in failure analysis and non-destructive evaluation. It also has applications in biological and medical research. The semiconductor industry has found the SAM useful in detecting voids, cracks, and delaminations within microelectronic packages.

Minimum resolvable contrast (MRC) is a subjective measure of a visible spectrum sensor’s or camera's sensitivity and ability to resolve data. A snapshot image of a series of three bar targets of selected spatial frequencies and various contrast coatings captured by the unit under test (UUT) is used to determine the MRC of the UUT, i.e. the visible spectrum camera or sensor. A trained observer selects the smallest target resolvable at each contrast level. Typically, specialized computer software collects the inputted data of the observer and provides a graph of contrast v.s. spatial frequency at a given luminance level. A first order polynomial is fitted to the data and an MRC curve of spatial frequency versus contrast is generated.

Ronchi ruling

A Ronchi ruling, Ronchi grating, or Ronchi mask, named after the Italian physicist Vasco Ronchi, is a constant-interval bar and space square-wave optical target or mask. The design produces a precisely patterned light source by reflection or illumination, or a stop pattern by transmission, with precise uniformity, spatial frequency, sharp edge definition, and high contrast ratio.

Test film

Test film are rolls or loops or slides of photographic film used for testing the quality of equipment. Equipment to be tested could include: telecine, motion picture film scanner, Movie projectors, Image scanners, film-out gear, Film recorders and Film scanners.

Super-resolution photoacoustic imaging is a set of techniques used to enhance spatial resolution in photoacoustic imaging. Specifically, these techniques primarily break the optical diffraction limit of the photoacoustic imaging system. It can be achieved in a variety of mechanisms, such as blind structured illumination, multi-speckle illumination, or photo-imprint photoacoustic microscopy in Figure 1.

References

  1. "Document Index for MIL-STD-150". Archived from the original on March 27, 2019. Retrieved August 10, 2019.{{cite web}}: CS1 maint: bot: original URL status unknown (link)