Amplitude-shift keying

Last updated

Amplitude-shift keying (ASK) is a form of amplitude modulation that represents digital data as variations in the amplitude of a carrier wave. In an ASK system, a symbol, representing one or more bits, is sent by transmitting a fixed-amplitude carrier wave at a fixed frequency for a specific time duration. For example, if each symbol represents a single bit, then the carrier signal could be transmitted at nominal amplitude when the input value is 1, but transmitted at reduced amplitude or not at all when the input value is 0.

Contents

Any digital modulation scheme uses a finite number of distinct signals to represent digital data. ASK uses a finite number of amplitudes, each assigned a unique pattern of binary digits. Usually, each amplitude encodes an equal number of bits. Each pattern of bits forms the symbol that is represented by the particular amplitude. The demodulator, which is designed specifically for the symbol-set used by the modulator, determines the amplitude of the received signal and maps it back to the symbol it represents, thus recovering the original data. Frequency and phase of the carrier are kept constant.

Like AM, an ASK is also linear and sensitive to atmospheric noise, distortions, propagation conditions on different routes in PSTN, etc. Both ASK modulation and demodulation processes are relatively inexpensive. The ASK technique is also commonly used to transmit digital data over optical fiber. For LED transmitters, binary 1 is represented by a short pulse of light and binary 0 by the absence of light. Laser transmitters normally have a fixed "bias" current that causes the device to emit a low light level. This low level represents binary 0, while a higher-amplitude lightwave represents binary 1.

The simplest and most common form of ASK operates as a switch, using the presence of a carrier wave to indicate a binary one and its absence to indicate a binary zero. This type of modulation is called on-off keying (OOK), and is used at radio frequencies to transmit Morse code (referred to as continuous wave operation),

More sophisticated encoding schemes have been developed which represent data in groups using additional amplitude levels. For instance, a four-level encoding scheme can represent two bits with each shift in amplitude; an eight-level scheme can represent three bits; and so on. These forms of amplitude-shift keying require a high signal-to-noise ratio for their recovery, as by their nature much of the signal is transmitted at reduced power.

ASK diagram Ask ideal diagram.png
ASK diagram

ASK system can be divided into three blocks. The first one represents the transmitter, the second one is a linear model of the effects of the channel, the third one shows the structure of the receiver. The following notation is used:

Different symbols are represented with different voltages. If the maximum allowed value for the voltage is A, then all the possible values are in the range [−A, A] and they are given by:

the difference between one voltage and the other is:

Considering the picture, the symbols v[n] are generated randomly by the source S, then the impulse generator creates impulses with an area of v[n]. These impulses are sent to the filter ht to be sent through the channel. In other words, for each symbol a different carrier wave is sent with the relative amplitude.

Out of the transmitter, the signal s(t) can be expressed in the form:

In the receiver, after the filtering through hr (t) the signal is:

where we use the notation:

where * indicates the convolution between two signals. After the A/D conversion the signal z[k] can be expressed in the form:

In this relationship, the second term represents the symbol to be extracted. The others are unwanted: the first one is the effect of noise, the third one is due to the intersymbol interference.

If the filters are chosen so that g(t) will satisfy the Nyquist ISI criterion, then there will be no intersymbol interference and the value of the sum will be zero, so:

the transmission will be affected only by noise.

Probability of error

The probability density function of having an error of a given size can be modelled by a Gaussian function; the mean value will be the relative sent value, and its variance will be given by:

where is the spectral density of the noise within the band and Hr (f) is the continuous Fourier transform of the impulse response of the filter hr (f).

The probability of making an error is given by:

where, for example, is the conditional probability of making an error given that a symbol v0 has been sent and is the probability of sending a symbol v0.

If the probability of sending any symbol is the same, then:

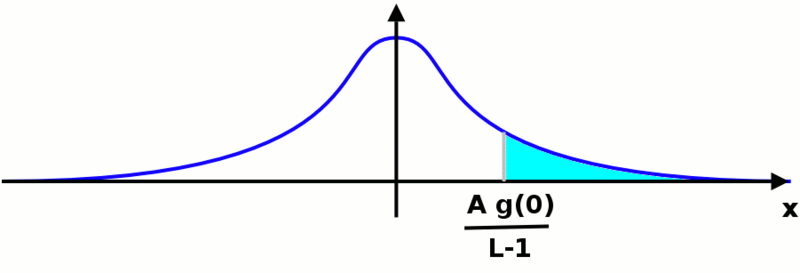
If we represent all the probability density functions on the same plot against the possible value of the voltage to be transmitted, we get a picture like this (the particular case of is shown):

Ask dia calc prob.png

The probability of making an error after a single symbol has been sent is the area of the Gaussian function falling under the functions for the other symbols. It is shown in cyan for just one of them. If we call the area under one side of the Gaussian, the sum of all the areas will be: . The total probability of making an error can be expressed in the form:

We now have to calculate the value of . In order to do that, we can move the origin of the reference wherever we want: the area below the function will not change. We are in a situation like the one shown in the following picture:

Ask dia calc prob 2.png

it does not matter which Gaussian function we are considering, the area we want to calculate will be the same. The value we are looking for will be given by the following integral:

where is the complementary error function. Putting all these results together, the probability to make an error is:

from this formula we can easily understand that the probability to make an error decreases if the maximum amplitude of the transmitted signal or the amplification of the system becomes greater; on the other hand, it increases if the number of levels or the power of noise becomes greater.

This relationship is valid when there is no intersymbol interference, i.e. is a Nyquist function.

See also

Related Research Articles

<span class="mw-page-title-main">Feynman diagram</span> Pictorial representation of the behavior of subatomic particles

In theoretical physics, a Feynman diagram is a pictorial representation of the mathematical expressions describing the behavior and interaction of subatomic particles. The scheme is named after American physicist Richard Feynman, who introduced the diagrams in 1948. The interaction of subatomic particles can be complex and difficult to understand; Feynman diagrams give a simple visualization of what would otherwise be an arcane and abstract formula. According to David Kaiser, "Since the middle of the 20th century, theoretical physicists have increasingly turned to this tool to help them undertake critical calculations. Feynman diagrams have revolutionized nearly every aspect of theoretical physics." While the diagrams are applied primarily to quantum field theory, they can also be used in other areas of physics, such as solid-state theory. Frank Wilczek wrote that the calculations that won him the 2004 Nobel Prize in Physics "would have been literally unthinkable without Feynman diagrams, as would [Wilczek's] calculations that established a route to production and observation of the Higgs particle."

<span class="mw-page-title-main">Fourier analysis</span> Branch of mathematics

In mathematics, Fourier analysis is the study of the way general functions may be represented or approximated by sums of simpler trigonometric functions. Fourier analysis grew from the study of Fourier series, and is named after Joseph Fourier, who showed that representing a function as a sum of trigonometric functions greatly simplifies the study of heat transfer.

<span class="mw-page-title-main">Entropy (information theory)</span> Expected amount of information needed to specify the output of a stochastic data source

In information theory, the entropy of a random variable is the average level of "information", "surprise", or "uncertainty" inherent to the variable's possible outcomes. Given a discrete random variable , which takes values in the alphabet and is distributed according to :

<span class="mw-page-title-main">Dirac delta function</span> Generalized function whose value is zero everywhere except at zero

In mathematical physics, the Dirac delta distribution, also known as the unit impulse, is a generalized function or distribution over the real numbers, whose value is zero everywhere except at zero, and whose integral over the entire real line is equal to one.

Phase-shift keying (PSK) is a digital modulation process which conveys data by changing (modulating) the phase of a constant frequency carrier wave. The modulation is accomplished by varying the sine and cosine inputs at a precise time. It is widely used for wireless LANs, RFID and Bluetooth communication.

<span class="mw-page-title-main">Probability density function</span> Function whose integral over a region describes the probability of an event occurring in that region

In probability theory, a probability density function (PDF), or density of an absolutely continuous random variable, is a function whose value at any given sample in the sample space can be interpreted as providing a relative likelihood that the value of the random variable would be equal to that sample. Probability density is the probability per unit length, in other words, while the absolute likelihood for a continuous random variable to take on any particular value is 0, the value of the PDF at two different samples can be used to infer, in any particular draw of the random variable, how much more likely it is that the random variable would be close to one sample compared to the other sample.

<span class="mw-page-title-main">Fourier transform</span> Mathematical transform that expresses a function of time as a function of frequency

In physics and mathematics, the Fourier transform (FT) is a transform that converts a function into a form that describes the frequencies present in the original function. The output of the transform is a complex-valued function of frequency. The term Fourier transform refers to both this complex-valued function and the mathematical operation. When a distinction needs to be made the Fourier transform is sometimes called the frequency domain representation of the original function. The Fourier transform is analogous to decomposing the sound of a musical chord into terms of the intensity of its constituent pitches.

<span class="mw-page-title-main">Fourier series</span> Decomposition of periodic functions into sums of simpler sinusoidal forms

A Fourier series is an expansion of a periodic function into a sum of trigonometric functions. The Fourier series is an example of a trigonometric series, but not all trigonometric series are Fourier series. By expressing a function as a sum of sines and cosines, many problems involving the function become easier to analyze because trigonometric functions are well understood. For example, Fourier series were first used by Joseph Fourier to find solutions to the heat equation. This application is possible because the derivatives of trigonometric functions fall into simple patterns. Fourier series cannot be used to approximate arbitrary functions, because most functions have infinitely many terms in their Fourier series, and the series do not always converge. Well-behaved functions, for example smooth functions, have Fourier series that converge to the original function. The coefficients of the Fourier series are determined by integrals of the function multiplied by trigonometric functions, described in Common forms of the Fourier series below.

<span class="mw-page-title-main">Bernoulli process</span> Random process of binary (boolean) random variables

In probability and statistics, a Bernoulli process is a finite or infinite sequence of binary random variables, so it is a discrete-time stochastic process that takes only two values, canonically 0 and 1. The component Bernoulli variablesXi are identically distributed and independent. Prosaically, a Bernoulli process is a repeated coin flipping, possibly with an unfair coin. Every variable Xi in the sequence is associated with a Bernoulli trial or experiment. They all have the same Bernoulli distribution. Much of what can be said about the Bernoulli process can also be generalized to more than two outcomes ; this generalization is known as the Bernoulli scheme.

Golomb coding is a lossless data compression method using a family of data compression codes invented by Solomon W. Golomb in the 1960s. Alphabets following a geometric distribution will have a Golomb code as an optimal prefix code, making Golomb coding highly suitable for situations in which the occurrence of small values in the input stream is significantly more likely than large values.

<span class="mw-page-title-main">Error function</span> Sigmoid shape special function

In mathematics, the error function, often denoted by erf, is a complex function of a complex variable defined as:

In probability theory and statistics, the moment-generating function of a real-valued random variable is an alternative specification of its probability distribution. Thus, it provides the basis of an alternative route to analytical results compared with working directly with probability density functions or cumulative distribution functions. There are particularly simple results for the moment-generating functions of distributions defined by the weighted sums of random variables. However, not all random variables have moment-generating functions.

In mathematics, a Gaussian function, often simply referred to as a Gaussian, is a function of the base form

<span class="mw-page-title-main">Quantization (signal processing)</span> Process of mapping a continuous set to a countable set

Quantization, in mathematics and digital signal processing, is the process of mapping input values from a large set to output values in a (countable) smaller set, often with a finite number of elements. Rounding and truncation are typical examples of quantization processes. Quantization is involved to some degree in nearly all digital signal processing, as the process of representing a signal in digital form ordinarily involves rounding. Quantization also forms the core of essentially all lossy compression algorithms.

In mathematical analysis, asymptotic analysis, also known as asymptotics, is a method of describing limiting behavior.

In signal processing, a matched filter is obtained by correlating a known delayed signal, or template, with an unknown signal to detect the presence of the template in the unknown signal. This is equivalent to convolving the unknown signal with a conjugated time-reversed version of the template. The matched filter is the optimal linear filter for maximizing the signal-to-noise ratio (SNR) in the presence of additive stochastic noise.

<span class="mw-page-title-main">Linear time-invariant system</span> Mathematical model which is both linear and time-invariant

In system analysis, among other fields of study, a linear time-invariant (LTI) system is a system that produces an output signal from any input signal subject to the constraints of linearity and time-invariance; these terms are briefly defined below. These properties apply (exactly or approximately) to many important physical systems, in which case the response y(t) of the system to an arbitrary input x(t) can be found directly using convolution: y(t) = (xh)(t) where h(t) is called the system's impulse response and ∗ represents convolution (not to be confused with multiplication). What's more, there are systematic methods for solving any such system (determining h(t)), whereas systems not meeting both properties are generally more difficult (or impossible) to solve analytically. A good example of an LTI system is any electrical circuit consisting of resistors, capacitors, inductors and linear amplifiers.

<span class="mw-page-title-main">Nyquist ISI criterion</span>

In communications, the Nyquist ISI criterion describes the conditions which, when satisfied by a communication channel, result in no intersymbol interference or ISI. It provides a method for constructing band-limited functions to overcome the effects of intersymbol interference.

<span class="mw-page-title-main">Wavelet transform</span> Mathematical technique used in data compression and analysis

In mathematics, a wavelet series is a representation of a square-integrable function by a certain orthonormal series generated by a wavelet. This article provides a formal, mathematical definition of an orthonormal wavelet and of the integral wavelet transform.

<span class="mw-page-title-main">Transmission coefficient</span>

The transmission coefficient is used in physics and electrical engineering when wave propagation in a medium containing discontinuities is considered. A transmission coefficient describes the amplitude, intensity, or total power of a transmitted wave relative to an incident wave.