
A logic gate is an idealized or physical device that performs a Boolean function, a logical operation performed on one or more binary inputs that produces a single binary output.

A programmable logic controller (PLC) or programmable controller is an industrial computer that has been ruggedized and adapted for the control of manufacturing processes, such as assembly lines, machines, robotic devices, or any activity that requires high reliability, ease of programming, and process fault diagnosis. Dick Morley is considered as the father of PLC as he had invented the first PLC, the Modicon 084, for General Motors in 1968.

A schematic, or schematic diagram, is a designed representation of the elements of a system using abstract, graphic symbols rather than realistic pictures. A schematic usually omits all details that are not relevant to the key information the schematic is intended to convey, and may include oversimplified elements in order to make this essential meaning easier to grasp, as well as additional organization of the information.
Supervisory control and data acquisition (SCADA) is a control system architecture comprising computers, networked data communications and graphical user interfaces for high-level supervision of machines and processes. It also covers sensors and other devices, such as programmable logic controllers, which interface with process plant or machinery.
Ladder logic was originally a written method to document the design and construction of relay racks as used in manufacturing and process control. Each device in the relay rack would be represented by a symbol on the ladder diagram with connections between those devices shown. In addition, other items external to the relay rack such as pumps, heaters, and so forth would also be shown on the ladder diagram.
A distributed control system (DCS) is a computerised control system for a process or plant usually with many control loops, in which autonomous controllers are distributed throughout the system, but there is no central operator supervisory control. This is in contrast to systems that use centralized controllers; either discrete controllers located at a central control room or within a central computer. The DCS concept increases reliability and reduces installation costs by localising control functions near the process plant, with remote monitoring and supervision.
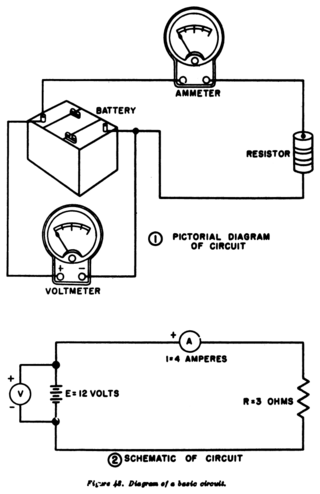
A circuit diagram is a graphical representation of an electrical circuit. A pictorial circuit diagram uses simple images of components, while a schematic diagram shows the components and interconnections of the circuit using standardized symbolic representations. The presentation of the interconnections between circuit components in the schematic diagram does not necessarily correspond to the physical arrangements in the finished device.
A piping and instrumentation diagram is a detailed diagram in the process industry which shows the piping and process equipment together with the instrumentation and control devices.
IDEF0, a compound acronym, is a function modeling methodology for describing manufacturing functions, which offers a functional modeling language for the analysis, development, reengineering and integration of information systems, business processes or software engineering analysis.

An electronic symbol is a pictogram used to represent various electrical and electronic devices or functions, such as wires, batteries, resistors, and transistors, in a schematic diagram of an electrical or electronic circuit. These symbols are largely standardized internationally today, but may vary from country to country, or engineering discipline, based on traditional conventions.
IEC 61131 is an IEC standard for programmable controllers. It was first published in 1993; the current (third) edition dates from 2013. It was known as IEC 1131 before the change in numbering system by IEC. The parts of the IEC 61131 standard are prepared and maintained by working group 7, programmable control systems, of subcommittee SC 65B of Technical Committee TC65 of the IEC.
The international standard IEC 61499, addressing the topic of function blocks for industrial process measurement and control systems, was initially published by the International Electrotechnical Commission (IEC) in 2005. The specification of IEC 61499 defines a generic model for distributed control systems and is based on the IEC 61131 standard. The concepts of IEC 61499 are also explained by Lewis and Zoitl as well as Vyatkin.
In computer programming, flow-based programming (FBP) is a programming paradigm that defines applications as networks of black box processes, which exchange data across predefined connections by message passing, where the connections are specified externally to the processes. These black box processes can be reconnected endlessly to form different applications without having to be changed internally. FBP is thus naturally component-oriented.
A process flow diagram (PFD) is a diagram commonly used in chemical and process engineering to indicate the general flow of plant processes and equipment. The PFD displays the relationship between major equipment of a plant facility and does not show minor details such as piping details and designations. Another commonly used term for a PFD is flowsheet.

In software engineering, structured analysis (SA) and structured design (SD) are methods for analyzing business requirements and developing specifications for converting practices into computer programs, hardware configurations, and related manual procedures.
Relay logic is a method of implementing combinational logic in electrical control circuits by using several electrical relays wired in a particular configuration.
In systems engineering, software engineering, and computer science, a function model or functional model is a structured representation of the functions within the modeled system or subject area.

A functional flow block diagram (FFBD) is a multi-tier, time-sequenced, step-by-step flow diagram of a system's functional flow. The term "functional" in this context is different from its use in functional programming or in mathematics, where pairing "functional" with "flow" would be ambiguous. Here, "functional flow" pertains to the sequencing of operations, with "flow" arrows expressing dependence on the success of prior operations. FFBDs may also express input and output data dependencies between functional blocks, as shown in figures below, but FFBDs primarily focus on sequencing.
Electrical system design is the design of electrical systems. This can be as simple as a flashlight cell connected through two wires to a light bulb or as involved as the Space Shuttle. Electrical systems are groups of electrical components connected to carry out some operation. Often the systems are combined with other systems. They might be subsystems of larger systems and have subsystems of their own. For example, a subway rapid transit electrical system is composed of the wayside electrical power supply, wayside control system, and the electrical systems of each transit car. Each transit car’s electrical system is a subsystem of the subway system. Inside of each transit car there are also subsystems, such as the car climate control system.

The Function Block Diagram (FBD) is a graphical language for programmable logic controller design, that can describe the function between input variables and output variables. A function is described as a set of elementary blocks. Input and output variables are connected to blocks by connection lines.
