Elections to Buckinghamshire County Council were held on 5 May 2005, alongside the 2005 UK General Election and other local elections in England and Northern Ireland. The entire council was up for election, with each successful candidate serving a four-year term of office, expiring in 2009.
Buckinghamshire County Council is the upper-tier local authority for the non-metropolitan county of Buckinghamshire, in England, the United Kingdom established in 1889 following the Local Government Act 1888. The county council's offices are in Aylesbury.
The Conservative Party remained in overall control of the council, winning 44 out of 57 seats. 11 of the remaining seats were won by the Liberal Democrats, whilst the remaining 2 were won by Labour. [1]
The Conservative Party, officially the Conservative and Unionist Party, is a centre-right political party in the United Kingdom. Presently led by Theresa May, it has been the governing party since 2010. It presently has 314 Members of Parliament in the House of Commons, 249 members of the House of Lords, and 18 members of the European Parliament. It also has 31 Members of the Scottish Parliament, 12 members of the Welsh Assembly, eight members of the London Assembly and 9,008 local councillors. One of the major parties of UK politics, it has formed the government on 45 occasions, more than any other party.
The Liberal Democrats are a liberal political party in the United Kingdom. They presently have 11 Members of Parliament in the House of Commons, 96 members of the House of Lords, and one member of the European Parliament. They also have five Members of the Scottish Parliament and a member each in the Welsh Assembly and London Assembly. The party reached the height of its influence in the early 2010s, forming a junior partner in a coalition government from 2010 to 2015. It is presently led by Vince Cable.
The Labour Party is a centre-left political party in the United Kingdom which has been described as an alliance of social democrats, democratic socialists and trade unionists. The party's platform emphasises greater state intervention, social justice and strengthening workers' rights.
Party | Seats | Gains | Losses | Net gain/loss | Seats % | Votes % | Votes | +/− | |
---|---|---|---|---|---|---|---|---|---|
Conservative | 44 | +4 | 77.19 | 49.67 | 146,980 | ||||
Liberal Democrat | 11 | +2 | 19.30 | 32.88 | 97,289 | ||||
Labour | 2 | -3 | 3.51 | 15.91 | 47,072 | ||||
Aylesbury Residents Association | 0 | 0 | 0.87 | 2,587 | |||||
UKIP | 0 | 0 | 0.41 | 1,200 | |||||
Green | 0 | 0 | 0.26 | 777 |
The overall turnout was 65.4% with a total of 295,905 valid votes cast. A total of 2,397 ballots were rejected.
After the election, the composition of the council was:
44 | 11 | 2 |
Conservatives | Liberal Democrats | L |
L - Labour
All results by ward are listed below. The turnout numbers recorded is the valid voter turnout, not the total number of ballots cast including those that were spoiled. [2]
Party | Candidate | Votes | % | ± | |
---|---|---|---|---|---|
Conservative | Lesley Clarke | 1,804 | 50.1 | ||
Labour | Carolyn Pudney | 996 | 27.7 | ||
Liberal Democrat | Stephen Guy | 801 | 22.2 | ||
Majority | 808 | 22.4 | |||
Turnout | 3,601 | 60.2 | |||
Conservative hold | Swing |
Party | Candidate | Votes | % | ± | |
---|---|---|---|---|---|
Conservative | William Lidgate | 2,339 | 61.8 | ||
Liberal Democrat | Edwina Mitchell | 1,446 | 38.2 | ||
Majority | 893 | 23.6 | |||
Turnout | 3,785 | 62.5 | |||
Conservative hold | Swing |
Party | Candidate | Votes | % | ± | |
---|---|---|---|---|---|
Conservative | David Meacock | 3,770 | 24.2 | ||
Conservative | Pauline Wilkinson | 3,651 | 23.4 | ||
Liberal Democrat | Davida Allen | 3,567 | 22.9 | ||
Liberal Democrat | Patricia Pearce | 2,739 | 17.6 | ||
Labour | Lynda Greenhill | 959 | 6.1 | ||
Labour | David Tench | 909 | 5.8 | ||
Majority | 84 | 0.5 | |||
Turnout | 8,707 | 66.0 | |||
Conservative hold | Swing | ||||
Conservative hold | Swing |
Party | Candidate | Votes | % | ± | |
---|---|---|---|---|---|
Conservative | William Chapple | 3,062 | 64.1 | ||
Liberal Democrat | Peter Vernon | 1,440 | 30.2 | ||
Aylesbury Residents Action | Andrew Hill | 273 | 5.7 | ||
Majority | 1,622 | 33.9 | |||
Turnout | 4,775 | 68.6 | |||
Conservative hold | Swing |
Party | Candidate | Votes | % | ± | |
---|---|---|---|---|---|
Liberal Democrat | Chloe Willetts | 2,789 | 21.4 | ||
Liberal Democrat | Raj Khan | 2,482 | 19.0 | ||
Conservative | Andrew Huxley | 2,377 | 18.2 | ||
Conservative | Abdul Khaliq | 1,791 | 13.7 | ||
Labour | Richard Wells | 1,224 | 9.4 | ||
Labour | Mohammed Khaliel | 1,084 | 8.3 | ||
Independent | Patrick Martin | 659 | 5.1 | ||
Aylesbury Residents Action | Julia Powell | 323 | 2.5 | ||
Aylesbury Residents Action | Elsie Davies | 303 | 2.3 | ||
Majority | 105 | 0.8 | |||
Turnout | 13,032 | 60.0 | |||
Liberal Democrat hold | Swing | ||||
Liberal Democrat hold | Swing |
Party | Candidate | Votes | % | ± | |
---|---|---|---|---|---|
Liberal Democrat | Mary Baldwin | 2,159 | 22.2 | ||
Liberal Democrat | Niknam Hussain | 1,665 | 17.1 | ||
Conservative | Jane Sale | 1,587 | 16.3 | ||
Conservative | Wajid Kiani | 1,262 | 13.0 | ||
Labour | Philip McGoldrick | 1,225 | 12.6 | ||
Labour | Sandra Moorcroft | 1,019 | 10.5 | ||
Aylesbury Residents Action | Suzanna Copcutt | 419 | 4.3 | ||
Aylesbury Residents Action | David Davies | 379 | 3.9 | ||
Majority | 78 | 5.1 | |||
Turnout | 9,715 | 52.2 | |||
Liberal Democrat hold | Swing | ||||
Liberal Democrat hold | Swing |
Party | Candidate | Votes | % | ± | |
---|---|---|---|---|---|
Liberal Democrat | Denise Summers | 1,446 | 39.0 | ||
Conservative | Elisabeth Wilkins | 1,435 | 38.7 | ||
Labour | Henry Gardner | 730 | 19.7 | ||
Aylesbury Residents Action | Margaret Martin | 100 | 2.7 | ||
Majority | 11 | 0.3 | |||
Turnout | 3,711 | 61.1 | |||
Liberal Democrat hold | Swing |
Party | Candidate | Votes | % | ± | |
---|---|---|---|---|---|
Liberal Democrat | Chester Jones | 2,330 | 47.4 | ||
Conservative | John Champion | 1,917 | 39.0 | ||
Labour | Adrian Mumford-Smith | 570 | 11.6 | ||
Aylesbury Residents Action | Dennis Price | 95 | 1.9 | ||
Majority | 413 | 8.4 | |||
Turnout | 4,912 | 72.0 | |||
Liberal Democrat hold | Swing |
Party | Candidate | Votes | % | ± | |
---|---|---|---|---|---|
Liberal Democrat | Freda Roberts | 3,074 | 21.1 | ||
Liberal Democrat | Steve Kennell | 3,050 | 21.0 | ||
Conservative | Brian Foster | 2,283 | 15.7 | ||
Conservative | John Wiseman | 2,283 | 15.7 | ||
Labour | Neal Bonham | 1,755 | 12.1 | ||
Labour | Zard Khan | 1,479 | 10.2 | ||
Aylesbury Residents Action | Julie Ludlow | 333 | 2.3 | ||
Aylesbury Residents Action | Martin Hill | 292 | 2.0 | ||
Majority | 767 | 5.3 | |||
Turnout | 14,549 | 54.5 | |||
Liberal Democrat hold | Swing | ||||
Liberal Democrat hold | Swing |
Party | Candidate | Votes | % | ± | |
---|---|---|---|---|---|
Conservative | Margaret Dewar | 2,546 | 65.1 | ||
Liberal Democrat | Barbara Wainwright | 856 | 21.9 | ||
Labour | Stephen Lathrope | 511 | 13.1 | ||
Majority | 1,690 | 43.2 | |||
Turnout | 3,913 | 67.7 | |||
Conservative hold | Swing |
Party | Candidate | Votes | % | ± | |
---|---|---|---|---|---|
Conservative | Michael Edmonds | 3,189 | 59.0 | ||
Labour | Joanna Dodsworth | 1,113 | 20.6 | ||
Liberal Democrat | Alan Sherwell | 1,106 | 20.5 | ||
Majority | 2,076 | 38.4 | |||
Turnout | 5,408 | 72.9 | |||
Conservative hold | Swing |
Party | Candidate | Votes | % | ± | |
---|---|---|---|---|---|
Conservative | Alan Hill | 1,397 | 39.0 | ||
Labour | Nigel Vickery | 1,303 | 36.4 | ||
Liberal Democrat | Tuffail Hussain | 529 | 14.8 | ||
UKIP | Lynne Pearce | 354 | 9.9 | ||
Majority | 94 | 2.6 | |||
Turnout | 3,583 | 58.2 | |||
Conservative hold | Swing |
Party | Candidate | Votes | % | ± | |
---|---|---|---|---|---|
Labour | Julia Wassell | 2,555 | 24.3 | ||
Labour | Chaudhary Ditta | 2,003 | 19.0 | ||
Conservative | Kathleen Dix | 1,874 | 17.8 | ||
Conservative | Ian McEnnis | 1,756 | 16.7 | ||
Liberal Democrat | Frances Alexander | 1,185 | 11.2 | ||
Liberal Democrat | Ian Morton | 1,163 | 11.0 | ||
Majority | 129 | 1.2 | |||
Turnout | 10,536 | 53.9 | |||
Labour hold | Swing | ||||
Labour hold | Swing |
Party | Candidate | Votes | % | ± | |
---|---|---|---|---|---|
Conservative | David Polhill | 2,141 | 50.7 | ||
Labour | Robert Lehmann | 1,194 | 28.3 | ||
Liberal Democrat | Robert Lewis | 884 | 21.0 | ||
Majority | 947 | 22.4 | |||
Turnout | 4,219 | 63.0 | |||
Conservative hold | Swing |
Party | Candidate | Votes | % | ± | |
---|---|---|---|---|---|
Conservative | Hedley Cadd | 2,374 | 49.2 | ||
Labour | Robin Stuchbury | 1,718 | 35.6 | ||
Liberal Democrat | Michael Cashman | 738 | 15.3 | ||
Majority | 656 | 13.6 | |||
Turnout | 4,830 | 68.0 | |||
Conservative hold | Swing |
Party | Candidate | Votes | % | ± | |
---|---|---|---|---|---|
Conservative | Peter Hardy | 2,513 | 65.2 | ||
Liberal Democrat | Jane Hartley | 850 | 22.0 | ||
Labour | Phillip Oram | 493 | 12.8 | ||
Majority | 1,663 | 43.2 | |||
Turnout | 3,856 | 66.1 | |||
Conservative hold | Swing |
Party | Candidate | Votes | % | ± | |
---|---|---|---|---|---|
Conservative | Linda Hazell | 2,239 | 60.5 | ||
Liberal Democrat | David Linsdall | 802 | 21.7 | ||
Labour | Mark Craddock | 658 | 17.8 | ||
Majority | 1,437 | 38.8 | |||
Turnout | 3,699 | 61.2 | |||
Conservative hold | Swing |
Party | Candidate | Votes | % | ± | |
---|---|---|---|---|---|
Conservative | Bruce Allen | 2,512 | 59.8 | ||
Liberal Democrat | Richard Williams | 1,006 | 24.0 | ||
Labour | Malcolm Horne | 682 | 16.2 | ||
Majority | 1,506 | 35.8 | |||
Turnout | 4,200 | 62.8 | |||
Conservative hold | Swing |
Party | Candidate | Votes | % | ± | |
---|---|---|---|---|---|
Liberal Democrat | Patricia Lindsley | 2,003 | 44.4 | ||
Conservative | Mohammed Bhatti | 1,632 | 36.1 | ||
Labour | Kathryn Drinkall | 532 | 11.8 | ||
Green | Nicholas Wilkins | 348 | 7.7 | ||
Majority | 371 | 8.3 | |||
Turnout | 4,515 | 65.4 | |||
Liberal Democrat hold | Swing |
Party | Candidate | Votes | % | ± | |
---|---|---|---|---|---|
Conservative | Steven Adams | 1,363 | 38.8 | ||
Liberal Democrat | Michael Brand | 1,333 | 38.0 | ||
Labour | Peter Ward | 632 | 18.0 | ||
Green | Phillip Folly | 184 | 5.2 | ||
Majority | 30 | 0.8 | |||
Turnout | 3,512 | 65.8 | |||
Conservative hold | Swing |
Party | Candidate | Votes | % | ± | |
---|---|---|---|---|---|
Conservative | Hugh Wilson | 1,439 | 42.2 | ||
Liberal Democrat | Jane Bramwell | 1,225 | 35.9 | ||
Labour | David Cross | 499 | 14.6 | ||
Green | Kathleen Folly | 245 | 7.2 | ||
Majority | 214 | 6.3 | |||
Turnout | 3,408 | 64.5 | |||
Conservative hold | Swing |
Party | Candidate | Votes | % | ± | |
---|---|---|---|---|---|
Conservative | Patricia Birchley | 2,395 | 59.8 | ||
Liberal Democrat | John Clutterbuck | 1,222 | 30.5 | ||
Labour | Barbara Hunter | 389 | 9.7 | ||
Majority | 1,173 | 29.3 | |||
Turnout | 4,006 | 72.1 | |||
Conservative hold | Swing |
Party | Candidate | Votes | % | ± | |
---|---|---|---|---|---|
Conservative | Robert Woollard | 2,221 | 57.0 | ||
Liberal Democrat | Neil Timberlake | 814 | 20.9 | ||
Labour | Kathleen Draper | 689 | 17.7 | ||
UKIP | Brian Pearce | 171 | 4.4 | ||
Majority | 1,407 | 36.1 | |||
Turnout | 3,895 | 65.5 | |||
Conservative hold | Swing |
Party | Candidate | Votes | % | ± | |
---|---|---|---|---|---|
Conservative | Wendy Mallen | 2,991 | 21.3 | ||
Conservative | Zahir Mohammed | 2,521 | 17.9 | ||
Liberal Democrat | Pamela Brooks | 2,282 | 16.2 | ||
Labour | Sajid Ali | 2,260 | 16.1 | ||
Labour | Chaudry Shafique | 2,247 | 16.0 | ||
Liberal Democrat | William Doran | 1,749 | 12.4 | ||
Majority | 239 | 1.7 | |||
Turnout | 14,050 | 60.4 | |||
Conservative hold | Swing | ||||
Conservative hold | Swing |
Party | Candidate | Votes | % | ± | |
---|---|---|---|---|---|
Conservative | Peter Roberts | 2,260 | 63.6 | ||
Liberal Democrat | Gillian Underwood | 815 | 22.9 | ||
Labour | John Hunter | 481 | 13.5 | ||
Majority | 1,445 | 40.7 | |||
Turnout | 3,556 | 62.8 | |||
Conservative hold | Swing |
Party | Candidate | Votes | % | ± | |
---|---|---|---|---|---|
Conservative | Brenda Jennings | 2,765 | 60.8 | ||
Liberal Democrat | Llewellyn Monger | 1,781 | 39.2 | ||
Majority | 984 | 21.6 | |||
Turnout | 4,546 | 72.1 | |||
Conservative hold | Swing |
Party | Candidate | Votes | % | ± | |
---|---|---|---|---|---|
Conservative | Michael Colston | 2,882 | 58.8 | ||
Liberal Democrat | Sebastian Berry | 2,018 | 41.2 | ||
Majority | 864 | 17.6 | |||
Turnout | 4,900 | 70.9 | |||
Conservative hold | Swing |
Party | Candidate | Votes | % | ± | |
---|---|---|---|---|---|
Conservative | Richard Pushman | 3,123 | 64.6 | ||
Liberal Democrat | William Barnes | 1,710 | 35.4 | ||
Majority | 1,413 | 29.2 | |||
Turnout | 4,833 | 73.9 | |||
Conservative hold | Swing |
Party | Candidate | Votes | % | ± | |
---|---|---|---|---|---|
Conservative | John Cartwright | 2,744 | 56.6 | ||
Liberal Democrat | Ian Metherell | 2,100 | 43.4 | ||
Majority | 644 | 13.2 | |||
Turnout | 4,844 | 67.0 | |||
Conservative hold | Swing |
Party | Candidate | Votes | % | ± | |
---|---|---|---|---|---|
Conservative | Margaret Aston | 2,494 | 55.8 | ||
Liberal Democrat | Eileen Young | 1,978 | 44.2 | ||
Majority | 516 | 11.6 | |||
Turnout | 4,472 | 70.0 | |||
Conservative hold | Swing |
Party | Candidate | Votes | % | ± | |
---|---|---|---|---|---|
Conservative | David Carroll | 3,471 | 71.8 | ||
Labour | Ian Bates | 1,364 | 28.2 | ||
Majority | 2,107 | 43.6 | |||
Turnout | 4,835 | 65.9 | |||
Conservative hold | Swing |
Party | Candidate | Votes | % | ± | |
---|---|---|---|---|---|
Conservative | Paul Rogerson | 3,124 | 65.7 | ||
Liberal Democrat | Lee Harte | 1,092 | 23.0 | ||
Labour | Anne Edwards | 541 | 11.4 | ||
Majority | 2,032 | 42.7 | |||
Turnout | 4,757 | 71.6 | |||
Conservative hold | Swing |
Party | Candidate | Votes | % | ± | |
---|---|---|---|---|---|
Liberal Democrat | Alex Oxley | 2,011 | 52.6 | ||
Conservative | Kathleen Webber | 1,811 | 47.4 | ||
Majority | 200 | 5.2 | |||
Turnout | 3,822 | 63.7 | |||
Liberal Democrat hold | Swing |
Party | Candidate | Votes | % | ± | |
---|---|---|---|---|---|
Liberal Democrat | Avril Davies | 2,722 | 53.0 | ||
Conservative | Terence Jones | 2,411 | 47.0 | ||
Majority | 311 | 6.0 | |||
Turnout | 5,133 | 73.3 | |||
Liberal Democrat hold | Swing |
Party | Candidate | Votes | % | ± | |
---|---|---|---|---|---|
Conservative | Douglas Anson | 4,040 | 23.9 | ||
Conservative | Frank Sweatman | 3,532 | 20.9 | ||
Liberal Democrat | Maurice Oram | 3,112 | 18.4 | ||
Liberal Democrat | James Campbell | 2,965 | 17.6 | ||
Labour | Janet Pritchard | 1,313 | 7.8 | ||
Labour | Paul Mansell | 1,241 | 7.4 | ||
UKIP | Diana Davis | 675 | 7.4 | ||
Majority | 420 | 2.5 | |||
Turnout | 16,878 | 68.2 | |||
Conservative hold | Swing | ||||
Conservative hold | Swing |
Party | Candidate | Votes | % | ± | |
---|---|---|---|---|---|
Conservative | Francis Robinson | 2,782 | 59.7 | ||
Liberal Democrat | Deborah Williams | 1,246 | 26.8 | ||
Labour | Michael Cole | 629 | 13.5 | ||
Majority | 1,536 | 32.9 | |||
Turnout | 4,657 | 69.0 | |||
Conservative hold | Swing |
Party | Candidate | Votes | % | ± | |
---|---|---|---|---|---|
Conservative | Elizabeth Lay | 2,908 | 24.6 | ||
Conservative | David Shakespeare | 2,781 | 23.5 | ||
Liberal Democrat | Ian Forbes | 1,875 | 15.9 | ||
Liberal Democrat | Trevor Snaith | 1,612 | 13.6 | ||
Labour | Clare Martens | 1,350 | 11.4 | ||
Labour | Peter Morris | 1,303 | 11.0 | ||
Majority | 906 | 7.6 | |||
Turnout | 11,829 | 60.7 | |||
Conservative hold | Swing | ||||
Conservative hold | Swing |
Party | Candidate | Votes | % | ± | |
---|---|---|---|---|---|
Conservative | Rodney Royston | 2,605 | 62.1 | ||
Liberal Democrat | Eamonn Lyons | 844 | 20.1 | ||
Labour | Lindsey Gillan | 743 | 17.7 | ||
Majority | 1,761 | 42.0 | |||
Turnout | 4,192 | 66.0 | |||
Conservative hold | Swing |
Party | Candidate | Votes | % | ± | |
---|---|---|---|---|---|
Conservative | Frank Downes | 2,369 | 54.0 | ||
Liberal Democrat | Rosemary Eames | 1,114 | 25.4 | ||
Labour | Samuel Trueman | 902 | 20.6 | ||
Majority | 1,255 | 28.6 | |||
Turnout | 4,385 | 63.4 | |||
Conservative hold | Swing |
Party | Candidate | Votes | % | ± | |
---|---|---|---|---|---|
Conservative | Peter Smith | 2,018 | 57.9 | ||
Liberal Democrat | Christopher Tucker | 1,469 | 42.1 | ||
Majority | 549 | 15.8 | |||
Turnout | 3,487 | 61.2 | |||
Conservative hold | Swing |
Party | Candidate | Votes | % | ± | |
---|---|---|---|---|---|
Conservative | Valerie Letheren | 1,784 | 47.2 | ||
Labour | Kiern Moran | 1,004 | 26.6 | ||
Liberal Democrat | Wendy Guy | 991 | 26.2 | ||
Majority | 780 | 20.6 | |||
Turnout | 3,779 | 61.7 | |||
Conservative hold | Swing |
Party | Candidate | Votes | % | ± | |
---|---|---|---|---|---|
Conservative | Michael Appleyard | 4,539 | 28.7 | ||
Conservative | David Watson | 4,052 | 25.6 | ||
Liberal Democrat | Brian Pollock | 2,843 | 18.0 | ||
Liberal Democrat | Jeff Herschel | 2,808 | 17.7 | ||
Labour | Michael Phelan | 1,592 | 10.1 | ||
Majority | 1,209 | 7.6 | |||
Turnout | 15,834 | 66.5 | |||
Conservative hold | Swing | ||||
Conservative hold | Swing |
Party | Candidate | Votes | % | ± | |
---|---|---|---|---|---|
Conservative | Pamela Bacon | 5,514 | 31.5 | ||
Conservative | Martin Tett | 4,882 | 27.9 | ||
Liberal Democrat | Michael Meakin | 2,578 | 14.7 | ||
Liberal Democrat | Peter Nowell | 2,535 | 14.5 | ||
Labour | Sarah Hutchison | 1,088 | 6.2 | ||
Labour | Gearoid De Barra | 922 | 5.3 | ||
Majority | 2,304 | 13.2 | |||
Turnout | 17,519 | 67.2 | |||
Conservative hold | Swing | ||||
Conservative hold | Swing |
Party | Candidate | Votes | % | ± | |
---|---|---|---|---|---|
Conservative | Dennis Green | 2,277 | 53.9 | ||
Liberal Democrat | Nelson Bathurst | 1,231 | 29.2 | ||
Labour | William Dore | 713 | 16.9 | ||
Majority | 1,046 | 24.7 | |||
Turnout | 4,221 | 67.2 | |||
Conservative hold | Swing |
Party | Candidate | Votes | % | ± | |
---|---|---|---|---|---|
Conservative | Marion Clayton | 1,984 | 48.9 | ||
Liberal Democrat | Christopher Peeler | 1,547 | 38.1 | ||
Labour | Robert Pile | 458 | 11.3 | ||
Aylesbury Residents Action | Dorothy Price | 70 | 1.7 | ||
Majority | 437 | 10.8 | |||
Turnout | 4,059 | 67.1 | |||
Conservative hold | Swing |
Party | Candidate | Votes | % | ± | |
---|---|---|---|---|---|
Conservative | Quintin Ings-Chambers | 2,323 | 55.9 | ||
Liberal Democrat | Mark Watson | 1,832 | 44.1 | ||
Majority | 491 | 11.8 | |||
Turnout | 4,155 | 71.3 | |||
Conservative hold | Swing |
Party | Candidate | Votes | % | ± | |
---|---|---|---|---|---|
Conservative | David Rowlands | 2,841 | 62.2 | ||
Liberal Democrat | Harold Newman | 1,725 | 37.8 | ||
Majority | 1,116 | 70.1 | |||
Turnout | 4,566 | 70.1 | |||
Conservative hold | Swing |
Dartford Borough Council is elected every four years.
Elections to Buckinghamshire County Council took place on 4 June 2009 as part of the United Kingdom local elections, 2009, having been delayed from 7 May, to coincide with elections to the European Parliament.
The 2002 elections to Southwark Council were held in the London Borough of Southwark, England, on 2 May 2002. The whole council was up for election, with boundary changes since the last election in 1998, reducing the number of seats by one. There were 63 seats in 21 wards. The Council moved from Labour controlled to no overall control, with a minority Liberal Democrat executive. Turnout was 26.2%.
Blundellsands is a Metropolitan Borough of Sefton ward in the Sefton Central Parliamentary constituency that covers the localities of Blundellsands and Brighton-le-Sands. The total population of this ward taken at the 2011 Census was 11,280.
Norwood is an area and Metropolitan Borough of Sefton ward in the Southport Parliamentary constituency that covers the localities of Blowick and Highpark in the town of Southport.
The first election to Herefordshire Council occurred on 4 May 2000, following the council's reconstitution as a unitary authority in 1998; following Herefordshire's separation from the short lived administrative county of Hereford and Worcester formed by a merger of Herefordshire and Worcestershire in 1974. All 37 wards were contested - each electing either one or two members to the council.
Elections for Cambridge City Council were held on Thursday 3 May 2012. One third of the council was up for election and the Liberal Democrats lost overall control of the council, to No Overall Control.
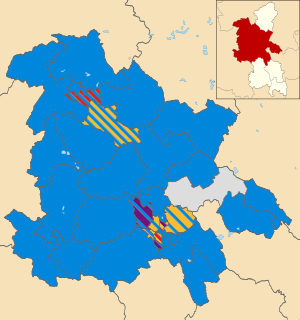
An election to Buckinghamshire County Council took place on 2 May 2013 as part of the United Kingdom local elections, 2013. 49 councillors were elected from electoral divisions which returned one county councillor each by first-past-the-post voting for a four-year term of office. Following a boundary review, the size of the council was reduced from 57 to 49 members for this election. No elections were held in Milton Keynes, which is a unitary authority outside the area covered by the County Council. The council continues to be administered on the Leader and Cabinet model. The Conservative Party won a reduced majority on the council.
Elections to Northumberland County Council were held on 2 May 2013. The full council was up for election, with each successful candidate serving a four-year term of office, expiring in 2017.
The 2014 Lambeth Council election was held on 22 May 2014 to elect members of Lambeth Council in Greater London, England. This was on the same day as other local elections. The election saw the Labour Party further increase its majority on the council, winning all but four of the 63 council seats.
The 2014 Sefton Metropolitan Borough Council election took on 22 May 2014 to elect one third of the council. It was held as part of the 2014 United Kingdom local elections.
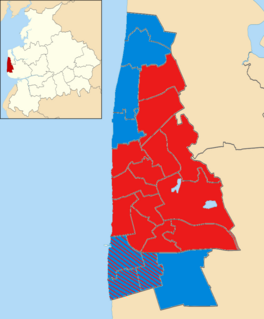
The 2015 Blackpool Borough Council election took place on 7 May 2015 to elect members of Blackpool Borough Council in England. All 21 wards of 2 seats each on the council were contested with newly elected members next due to serve a four-year term and next contest their seats in 2019. The council is made up oThis election took place on the same day as other local elections as well as the 2015 UK General Election.
The 2015 Aylesbury Vale District Council election took place on 7 May 2015 to elect members of Aylesbury Vale District Council in Buckinghamshire, England. The whole council was up for election with boundary changes since the last election in 2011. The Conservative party remained in overall control of the council.
The 2015 Basildon Borough Council election took place on 7 May 2015, as part of the United Kingdom local elections, 2015, and took place alongside the UK General Election. One third of seats were up for election, with these seats last being contested in 2011. As a result of the election, the council remained in no overall control. The Conservative Party remained as the largest party, and formed a minority administration.
Elections to elect all members (councillors) of Thanet District Council were held on 7 May 2015, as part of the United Kingdom local elections, 2015 taking place simultaneously with the 2015 General Election. Local UK Independence Party candidates won the council, becoming the governing group, the first time UKIP had won control of any type of local government unit above the level of a civil parish council, whether London Borough, Metropolitan Borough, Unitary Authority, Non-Metropolitan Borough or a District Council. The District has as its main towns the beach resort towns of Ramsgate, Margate and Broadstairs.
Elections to Central Bedfordshire Council were held on 7 May 2015, along with the United Kingdom general election, 2015 and other local elections. The whole council was up for election, with each successful candidate serving a four-year term of office, expiring in 2019.
Elections to elect all members (councillors) of Thanet District Council were held on 5 May 2011, as part of the United Kingdom local elections, 2011 taking place simultaneously with the Alternative Vote Referendum. No political party won an overall majority of seats, meaning that the council went into 'No Overall Control' status for the first time since 1991. The Conservative Party ran a minority administration until December that year, when a Conservative councillor defected to the Independents group, enabling The Labour Party to run a minority administration until 2015. The District has as its main towns the beach resort towns of Ramsgate, Margate and Broadstairs.
Elections to Herefordshire Council were held on 1 May 2003, along with other local elections in England and Scotland. Due to prior boundary reviews, all 38 wards were contested - with each ward electing either one two or three members to the council, with each successful candidate serving a four-year term of office, expiring in 2007. The council remained in no overall control, with the Conservative party replacing the Liberal Democrats as the largest party on the council, winning 20 out of a total of 56 seats on the council.
The 2017 Buckinghamshire County Council election took place on 4 May 2017 as part of the 2017 local elections in the United Kingdom. All 49 councillors were elected from electoral divisions which returned one county councillor each by first-past-the-post voting for a four-year term of office, due to expire in 2021.
The 2018 Swindon Borough Council election took place on 3 May 2018, to elect members of Swindon Borough Council in England. This was on the same day as other local elections.