Cytometry

Last updated
Cytometers are the instruments which count the blood cells in the common blood test. Blooddraw.jpg
Cytometers are the instruments which count the blood cells in the common blood test.

Cytometry is the measurement of number and characteristics of cells. Variables that can be measured by cytometric methods include cell size, cell count, cell morphology (shape and structure), cell cycle phase, DNA content, and the existence or absence of specific proteins on the cell surface or in the cytoplasm. [1] Cytometry is used to characterize and count blood cells in common blood tests such as the complete blood count. In a similar fashion, cytometry is also used in cell biology research and in medical diagnostics to characterize cells in a wide range of applications associated with diseases such as cancer and AIDS.[ citation needed ]

Contents

Cytometric devices

Image cytometers

Image cytometry is the oldest form of cytometry. Image cytometers operate by statically imaging a large number of cells using optical microscopy. Prior to analysis, cells are commonly stained to enhance contrast or to detect specific molecules by labeling these with fluorochromes. Traditionally, cells are viewed within a hemocytometer to aid manual counting.[ citation needed ]

Since the introduction of the digital camera, in the mid-1990s, the automation level of image cytometers has steadily increased. This has led to the commercial availability of automated image cytometers, ranging from simple cell counters to sophisticated high-content screening systems.

Flow cytometers

Due to the early difficulties of automating microscopy, the flow cytometer has since the mid-1950s been the dominating cytometric device. [2] Flow cytometers operate by aligning single cells using flow techniques. The cells are characterized optically or by the use of an electrical impedance method called the Coulter principle. To detect specific molecules when optically characterized, cells are in most cases stained with the same type of fluorochromes that are used by image cytometers. Flow cytometers generally provide less data than image cytometers, but have a significantly higher throughput.[ citation needed ]

Cell sorters

Cell sorters are flow cytometers capable of sorting cells according to their characteristics. The sorting is achieved by using technology similar to what is used in inkjet printers. The fluid stream is broken up into droplets by a mechanical vibration. The droplets are then electrically charged according to the characteristics of the cell contained within the droplet. Depending on their charge, the droplets are finally deflected by an electric field into different containers.[ citation needed ]

Time-lapse cytometers

A key characteristic of time-lapse cytometers is their use of non heat-generating light sources such as light-emitting diodes. This allows a time-lapse cytometer to be placed inside a conventional cell culture incubator to facilitate continuous observation of cellular processes without heat building up inside the incubator.

History

A hemocytometer Hemocytometer with gloved hand.JPG
A hemocytometer

Hemocytometer

The early history of cytometry is closely associated with the development of the blood cell counting. Through the work of Karl von Vierordt, Louis-Charles Malassez, Karl Bürker and others blood cell concentration could by the late 19th century be accurately measured using a blood cell counting chamber, the hemocytometer, and an optical microscope. [3] [4]

Until the 1950s the hemocytometer was the standard method to count blood cells. [5] In blood cell counting applications the hemocytometer has now been replaced by electronic cell counters. However, the hemocytometer is still being used to count cells in cell culture laboratories. Successively the manual task of counting, using a microscope, is taken over by small automated image cytometers.[ citation needed ]

Fluorescence microscope

In 1904, Moritz von Rohr and August Köhler at Carl Zeiss in Jena constructed the first ultraviolet microscope. The intent of the microscope was to obtain higher optical resolution by using illumination with a shorter wavelength than visual light. However, they experienced difficulties with autofluorescence when observing biological material. Fortunately, Köhler saw the potential of fluorescence. A filtering technique for fluorescence excitation light was developed by Heinrich Lehmann at Zeiss in 1910, based on work by Robert Wood. However, the "Lumineszenzmikroskop" he developed was only second on the market, after the one independently developed by Oskar Heimstädt who worked at C Reichert, Optische Werke AG in Vienna, which today is a part of Leica Microsystems. [6] [7] [8]

Cytophotometry

By the early 1930s various firms manufactured ultraviolet fluorescent microscopes. The stage was set for cytometry to now go beyond the now established hemocytometer. At this time, Torbjörn Caspersson, working at the Karolinska Institute in Stockholm, developed a series of progressively more sophisticated instruments called cytophotometers. These instruments combined a fluorescent microscope with a spectrophotometer to quantify cellular nucleic acids and their relation to cell growth and function. Caspersson’s early apparatus now seems hopelessly primitive. But, even this primitive apparatus got results, and attracted the attention of other researchers. Many of the advances in analytical cytology from the 1940s and on-wards were made by people who made the pilgrimage to Stockholm. [9]

Pulse cytophotometry

Model A Coulter Counter -- The first commercial flow cytometer Model A COULTER COUNTER from Advertisement.jpg
Model A Coulter Counter — The first commercial flow cytometer

The first attempts to automate cell counting were made around World War II. Gucker et al. builds a device to detect bacteria in aerosols. [10] Lagercrantz builds an automated cell counter based on microscopy [11] and identifies the difficulties in aligning cells to be individually counted using microscopy, as Moldavan had proposed in 1934. [12] Joseph and Wallace Coulter circumnavigates these difficulties by inventing the principle of using electrical impedance to count and size microscopic particles suspended in a fluid. [5] [13] This principle is today known as the Coulter principle and was used in the automated blood cell counter released by Coulter Electronics in 1954. The “Coulter counter” was the first commercial flow cytometer.[ citation needed ]

During the 1960s Dittrich, Göhde and Kamentsky improves the design pioneered by Caspersson 30 years earlier. Dittrich and Göhde’s pulse cytophotometer was built around a Zeiss fluorescent microscope and commercialized as the ICP 11 by Partec GmbH in 1968. Kamentsky’s device was commercialized by Bio/Physics Systems Inc. as the Cytograph in 1970. [14] [15] These devices were able to count cells, like the earlier Coulter counter. But more importantly, they were also capable of measuring cellular characteristics. However, these early cytophotometers where microscopy-based. [16]

Flow cytometry

In 1953 Crosland-Taylor published an unsuccessful attempt to count red blood cells using microscopy in which he solved the problem of aligning cells by using sheath fluid to hydrodynamically focus the cells. [2] In the late 1960s, Van Dilla at Los Alamos National Laboratory built the first non microscopy-based cytophotometer. He did this by combining Crosland-Taylor's breakthrough with the fluorescent dyes originally developed for microscopy and a laser-based fluorescent detection system — the flow cytometer as we know it today. [17] [18] [19] Fulwyler, at Los Alamos as well, combines the Coulter principle with continuous inkjet printer technology to create the first cell sorter in 1965. [20]

In 1973 Steinkamp and the team at Los Alamos follow up with a fluorescence-based cell sorter. [21]

In 1978, at the Conference of the American Engineering Foundation in Pensacola, Florida, the name pulse cytophotometry was changed to flow cytometry, a term which quickly became popular. [22] At that point pulse cytophotometry had evolved into the modern form of flow cytometry, pioneered by Van Dilla ten years earlier.[ citation needed ]

See also

Related Research Articles

<span class="mw-page-title-main">Microscopy</span> Viewing of objects which are too small to be seen with the naked eye

Microscopy is the technical field of using microscopes to view objects and areas of objects that cannot be seen with the naked eye. There are three well-known branches of microscopy: optical, electron, and scanning probe microscopy, along with the emerging field of X-ray microscopy.

<span class="mw-page-title-main">Complete blood count</span> Routine laboratory test of blood cells

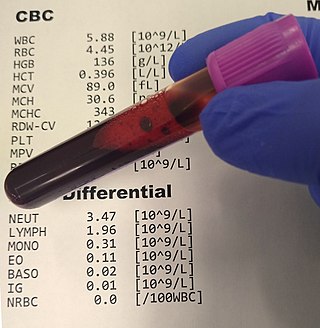
A complete blood count (CBC), also known as a full blood count (FBC), is a set of medical laboratory tests that provide information about the cells in a person's blood. The CBC indicates the counts of white blood cells, red blood cells and platelets, the concentration of hemoglobin, and the hematocrit. The red blood cell indices, which indicate the average size and hemoglobin content of red blood cells, are also reported, and a white blood cell differential, which counts the different types of white blood cells, may be included.

<span class="mw-page-title-main">Flow cytometry</span> Lab technique in biology and chemistry

Flow cytometry (FC) is a technique used to detect and measure physical and chemical characteristics of a population of cells or particles.

<span class="mw-page-title-main">Immunostaining</span> Biochemical technique

In biochemistry, immunostaining is any use of an antibody-based method to detect a specific protein in a sample. The term "immunostaining" was originally used to refer to the immunohistochemical staining of tissue sections, as first described by Albert Coons in 1941. However, immunostaining now encompasses a broad range of techniques used in histology, cell biology, and molecular biology that use antibody-based staining methods.

<span class="mw-page-title-main">Fluorescence microscope</span> Optical microscope that uses fluorescence and phosphorescence

A fluorescence microscope is an optical microscope that uses fluorescence instead of, or in addition to, scattering, reflection, and attenuation or absorption, to study the properties of organic or inorganic substances. "Fluorescence microscope" refers to any microscope that uses fluorescence to generate an image, whether it is a simple set up like an epifluorescence microscope or a more complicated design such as a confocal microscope, which uses optical sectioning to get better resolution of the fluorescence image.

<span class="mw-page-title-main">Coulter counter</span> Device to count and size particles

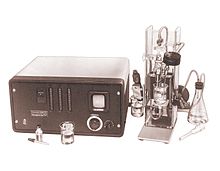
A Coulter counter is an apparatus for counting and sizing particles suspended in electrolytes. The Coulter counter is the commercial term for the technique known as resistive pulse sensing or electrical zone sensing. The apparatus is based on the Coulter principle named after its inventor, Wallace H. Coulter.

Fluorescence correlation spectroscopy (FCS) is a statistical analysis, via time correlation, of stationary fluctuations of the fluorescence intensity. Its theoretical underpinning originated from L. Onsager's regression hypothesis. The analysis provides kinetic parameters of the physical processes underlying the fluctuations. One of the interesting applications of this is an analysis of the concentration fluctuations of fluorescent particles (molecules) in solution. In this application, the fluorescence emitted from a very tiny space in solution containing a small number of fluorescent particles (molecules) is observed. The fluorescence intensity is fluctuating due to Brownian motion of the particles. In other words, the number of the particles in the sub-space defined by the optical system is randomly changing around the average number. The analysis gives the average number of fluorescent particles and average diffusion time, when the particle is passing through the space. Eventually, both the concentration and size of the particle (molecule) are determined. Both parameters are important in biochemical research, biophysics, and chemistry.

<span class="mw-page-title-main">Acridine orange</span> Organic dye used in biochemistry

Acridine orange is an organic compound that serves as a nucleic acid-selective fluorescent dye with cationic properties useful for cell cycle determination. Acridine orange is cell-permeable, which allows the dye to interact with DNA by intercalation, or RNA via electrostatic attractions. When bound to DNA, acridine orange is very similar spectrally to an organic compound known as fluorescein. Acridine orange and fluorescein have a maximum excitation at 502nm and 525 nm (green). When acridine orange associates with RNA, the fluorescent dye experiences a maximum excitation shift from 525 nm (green) to 460 nm (blue). The shift in maximum excitation also produces a maximum emission of 650 nm (red). Acridine orange is able to withstand low pH environments, allowing the fluorescent dye to penetrate acidic organelles such as lysosomes and phagolysosomes that are membrane-bound organelles essential for acid hydrolysis or for producing products of phagocytosis of apoptotic cells. Acridine orange is used in epifluorescence microscopy and flow cytometry. The ability to penetrate the cell membranes of acidic organelles and cationic properties of acridine orange allows the dye to differentiate between various types of cells. The shift in maximum excitation and emission wavelengths provides a foundation to predict the wavelength at which the cells will stain.

<span class="mw-page-title-main">Vertico spatially modulated illumination</span>

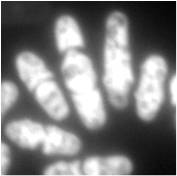
Vertico spatially modulated illumination (Vertico-SMI) is the fastest light microscope for the 3D analysis of complete cells in the nanometer range. It is based on two technologies developed in 1996, SMI and SPDM. The effective optical resolution of this optical nanoscope has reached the vicinity of 5 nm in 2D and 40 nm in 3D, greatly surpassing the λ/2 resolution limit applying to standard microscopy using transmission or reflection of natural light according to the Abbe resolution limit That limit had been determined by Ernst Abbe in 1873 and governs the achievable resolution limit of microscopes using conventional techniques.

Cell sorting is the process through which a particular cell type is separated from others contained in a sample on the basis of its physical or biological properties, such as size, morphological parameters, viability and both extracellular and intracellular protein expression. The homogeneous cell population obtained after sorting can be used for a variety of applications including research, diagnosis, and therapy.

<span class="mw-page-title-main">Microfluorimetry</span>

Microfluorimetry is an adaption of fluorimetry for studying the biochemical and biophysical properties of cells by using microscopy to image cell components tagged with fluorescent molecules. It is a type of microphotometry that gives a quantitative measure of the qualitative nature of fluorescent measurement and therefore, allows for definitive results that would have been previously indiscernible to the naked eye.

Super-resolution microscopy is a series of techniques in optical microscopy that allow such images to have resolutions higher than those imposed by the diffraction limit, which is due to the diffraction of light. Super-resolution imaging techniques rely on the near-field or on the far-field. Among techniques that rely on the latter are those that improve the resolution only modestly beyond the diffraction-limit, such as confocal microscopy with closed pinhole or aided by computational methods such as deconvolution or detector-based pixel reassignment, the 4Pi microscope, and structured-illumination microscopy technologies such as SIM and SMI.

<span class="mw-page-title-main">Virus counter</span> Instrument for quantification of viruses

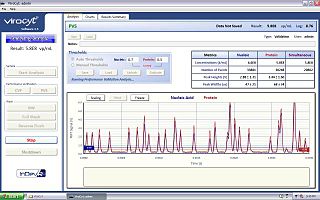
The virus counter is an instrument for rapid quantification of viruses in liquid samples. It is a specialized flow cytometer that uses high-sensitivity fluorescence detection to give a direct measurement of the concentration of virus particles in a fraction of the time required for traditional plaque assays.

<span class="mw-page-title-main">Digital holographic microscopy</span>

Digital holographic microscopy (DHM) is digital holography applied to microscopy. Digital holographic microscopy distinguishes itself from other microscopy methods by not recording the projected image of the object. Instead, the light wave front information originating from the object is digitally recorded as a hologram, from which a computer calculates the object image by using a numerical reconstruction algorithm. The image forming lens in traditional microscopy is thus replaced by a computer algorithm. Other closely related microscopy methods to digital holographic microscopy are interferometric microscopy, optical coherence tomography and diffraction phase microscopy. Common to all methods is the use of a reference wave front to obtain amplitude (intensity) and phase information. The information is recorded on a digital image sensor or by a photodetector from which an image of the object is created (reconstructed) by a computer. In traditional microscopy, which do not use a reference wave front, only intensity information is recorded and essential information about the object is lost.

Cell counting is any of various methods for the counting or similar quantification of cells in the life sciences, including medical diagnosis and treatment. It is an important subset of cytometry, with applications in research and clinical practice. For example, the complete blood count can help a physician to determine why a patient feels unwell and what to do to help. Cell counts within liquid media are usually expressed as a number of cells per unit of volume, thus expressing a concentration.

Photo-activated localization microscopy and stochastic optical reconstruction microscopy (STORM) are widefield fluorescence microscopy imaging methods that allow obtaining images with a resolution beyond the diffraction limit. The methods were proposed in 2006 in the wake of a general emergence of optical super-resolution microscopy methods, and were featured as Methods of the Year for 2008 by the Nature Methods journal. The development of PALM as a targeted biophysical imaging method was largely prompted by the discovery of new species and the engineering of mutants of fluorescent proteins displaying a controllable photochromism, such as photo-activatible GFP. However, the concomitant development of STORM, sharing the same fundamental principle, originally made use of paired cyanine dyes. One molecule of the pair, when excited near its absorption maximum, serves to reactivate the other molecule to the fluorescent state.

<span class="mw-page-title-main">Light sheet fluorescence microscopy</span> Fluorescence microscopy technique

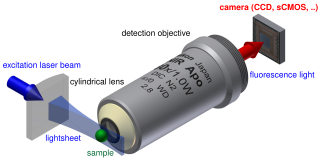
Light sheet fluorescence microscopy (LSFM) is a fluorescence microscopy technique with an intermediate-to-high optical resolution, but good optical sectioning capabilities and high speed. In contrast to epifluorescence microscopy only a thin slice of the sample is illuminated perpendicularly to the direction of observation. For illumination, a laser light-sheet is used, i.e. a laser beam which is focused only in one direction. A second method uses a circular beam scanned in one direction to create the lightsheet. As only the actually observed section is illuminated, this method reduces the photodamage and stress induced on a living sample. Also the good optical sectioning capability reduces the background signal and thus creates images with higher contrast, comparable to confocal microscopy. Because light sheet fluorescence microscopy scans samples by using a plane of light instead of a point, it can acquire images at speeds 100 to 1,000 times faster than those offered by point-scanning methods.

Holotomography (HT) is a laser technique to measure the three-dimensional refractive index (RI) tomogram of a microscopic sample such as biological cells and tissues. Because the RI can serve as an intrinsic imaging contrast for transparent or phase objects, measurements of RI tomograms can provide label-free quantitative imaging of microscopic phase objects. In order to measure 3-D RI tomogram of samples, HT employs the principle of holographic imaging and inverse scattering. Typically, multiple 2D holographic images of a sample are measured at various illumination angles, employing the principle of interferometric imaging. Then, a 3D RI tomogram of the sample is reconstructed from these multiple 2D holographic images by inversely solving light scattering in the sample.

Bacterioplankton counting is the estimation of the abundance of bacterioplankton in a specific body of water, which is useful information to marine microbiologists. Various counting methodologies have been developed over the years to determine the number present in the water being observed. Methods used for counting bacterioplankton include epifluorescence microscopy, flow cytometry, measures of productivity through frequency of dividing cells (FDC), thymidine incorporation, and leucine incorporation.

<span class="mw-page-title-main">White blood cell differential</span> Blood test

A white blood cell differential is a medical laboratory test that provides information about the types and amounts of white blood cells in a person's blood. The test, which is usually ordered as part of a complete blood count (CBC), measures the amounts of the five normal white blood cell types – neutrophils, lymphocytes, monocytes, eosinophils and basophils – as well as abnormal cell types if they are present. These results are reported as percentages and absolute values, and compared against reference ranges to determine whether the values are normal, low, or high. Changes in the amounts of white blood cells can aid in the diagnosis of many health conditions, including viral, bacterial, and parasitic infections and blood disorders such as leukemia.

References

  1. "International Society for Advancement of Cytometry". Archived from the original on 2013-03-28. Retrieved 2013-03-31.
  2. 1 2 Crosland-Taylor, P. J. (1953). "A device for counting small particles suspended in a fluid through a tube". Nature. 171 (4340): 37–38. Bibcode:1953Natur.171...37C. doi:10.1038/171037b0. PMID   13025472. S2CID   4273373.
  3. Verso, M. L. (1964). "The Evolution of Blood-Counting Techniques". Med. Hist. 8 (2): 149–158. doi:10.1017/s0025727300029392. PMC   1033366 . PMID   14139094.
  4. Verso, M. L. (1971). "Some nineteenth-century pioneers of haematology". Med. Hist. 15 (1): 55–67. doi:10.1017/s0025727300016124. PMC   1034115 . PMID   4929622.
  5. 1 2 "The History of Flow Cytometry". Beckman-Coulter Inc. Retrieved 2013-03-31.
  6. Rusk, N. (2009). "The fluorescence microscope". Milestones in Light Microscopy. Nature Publishing Group.
  7. Heimstädt O. (1911). "Das Fluoreszenzmikroskop". Z. Wiss. Mikrosk. 28: 330–337.
  8. Rost, F. W. D. (1995). Fluorescent microscopy, volume II. Cambridge University Press. pp. 183–187.
  9. Shapiro H. (2004). "The Evolution of Cytometers". Cytometry Part A. 58A (1): 13–20. doi: 10.1002/cyto.a.10111 . PMID   14994215. S2CID   836749.
  10. Gucker, F. T.; O’Konski, C. T.; Pickard, H. B.; Pitts, J. N. (1947). "A photoelectronic counter for colloidal particles". J Am Chem Soc. 69 (10): 2422–2431. doi:10.1021/ja01202a053. PMID   20268300.
  11. Lagercrantz, C. (1948). "Photo-electric Counting of Individual Microscopic Plant and Animal Cells". Nature. 161 (4079): 25–26. Bibcode:1948Natur.161...25L. doi:10.1038/161025b0. PMID   18933853. S2CID   4132780.
  12. Moldavan, A. (1934). "Photo-Electric Technique for the Counting of Microscopical Cells". Science. 80 (2069): 188–189. Bibcode:1934Sci....80..188M. doi:10.1126/science.80.2069.188. PMID   17817054.
  13. U.S.patent 2656508,Coulter W. H.,"Means for Counting Particles Suspended in a Fluid.",issued 1953-10-20
  14. "Flow Museum". Partec GmbH. Retrieved 2013-08-24.
  15. DE 1815352,Wolfgang Dittrich&Wolfgang Göhde,"Flow-through Chamber for Photometers to Measure and Count Particles in a Dispersion Medium"
  16. Kamentsky, L. A.; Melamed, M. R.; Derman, H (1965). "Spectrophotometer: New instrument for ultrarapid cell analysis". Science. 150 (3696): 630–1. Bibcode:1965Sci...150..630K. doi:10.1126/science.150.3696.630. PMID   5837105. S2CID   34776930.
  17. Van Dilla, M. A.; Trujillo, T. T.; Mullaney, P. F.; Coulter, J. R. (1969). "Cell microfluorometry: A method for rapid fluorescence measurement". Science. 163 (3872): 1213–1214. Bibcode:1969Sci...163.1213V. doi:10.1126/science.163.3872.1213. PMID   5812751. S2CID   13190489.
  18. "Cytometry Volume 10 – Los Alamos". Purdue University Cytometry Laboratories. Retrieved 2013-08-24.
  19. Robinson, J. P. (2009). "Cytometry – a Definitive History of the Early Days". In Sack, U.; Tárnok, A.; Rothe, G. (eds.). Cellular Diagnostics. Basics, Methods and Clinical Applications of Flow. Karger. pp. 1–28.
  20. Fulwyler, M. J. (1965). "Electronic separation of biological cells by volume". Science. 150 (698): 910–911. Bibcode:1965Sci...150..910F. doi:10.1126/science.150.3698.910. PMID   5891056. S2CID   459342.
  21. Steinkamp, J. A.; Fulwyler, M. J.; Coulter, J. R.; Hiebert, R. D.; Horney, J. L.; Mullancy, P. F. (1973). "A new multiparameter separator for microscopic particles and biological cells". Review of Scientific Instruments. 44 (9): 1301–1310. Bibcode:1973RScI...44.1301S. doi:10.1063/1.1686375. PMID   4279087.
  22. "Partec Flow Museum". Partec GmbH. Retrieved 2013-08-25.