The second election to Dyfed County Council was held in May 1977. [1] It was preceded by the 1973 election and followed by the 1981 election. There were a number of unopposed returns, particularly in rural parts of the county.
The main feature of the results in Carmarthenshire was a Plaid Cymru challenge to Labour in the more urban part of the county although they lost the one seat they held on the previous council.
Party | Candidate | Votes | % | ± | |
---|---|---|---|---|---|
Liberal | Evan Evans Williams* | Unopposed | |||
Liberal hold |
Party | Candidate | Votes | % | ± | |
---|---|---|---|---|---|
Independent | John E. Rogers-Lewis* | 1,125 | 62.5 | ||
Plaid Cymru | William Lynford Thomas | 676 | 37.5 | ||
Majority | |||||
Turnout | |||||
Independent hold | Swing |
Party | Candidate | Votes | % | ± | |
---|---|---|---|---|---|
Liberal | John Owen Williams* | 1,718 | 87.5 | ||
Plaid Cymru | Gerallt Jones | 246 | 12.5 | ||
Majority | |||||
Turnout | |||||
Liberal hold | Swing |
Party | Candidate | Votes | % | ± | |
---|---|---|---|---|---|
Labour | Griffith Eric Hughes | 1,492 | 80.4 | ||
Plaid Cymru | Elizabeth A. Edwards | 363 | 19.6 | ||
Majority | |||||
Turnout | |||||
Labour hold | Swing |
Party | Candidate | Votes | % | ± | |
---|---|---|---|---|---|
Labour | Peter James Goodman | 368 | 37.1 | ||
Liberal | Gwendoline Calan Evans* | 340 | 34.2 | ||
Plaid Cymru | John Davies | 285 | 28.7 | ||
Majority | |||||
Turnout | |||||
Labour gain from Liberal | Swing | ||||
Party | Candidate | Votes | % | ± | |
---|---|---|---|---|---|
Liberal | Ceredig Jones* | 765 | 52.7 | ||
Plaid Cymru | Mary Fitter | 686 | 47.3 | ||
Majority | |||||
Turnout | |||||
Liberal hold | Swing |
Party | Candidate | Votes | % | ± | |
---|---|---|---|---|---|
Liberal | John Gatty P. Lewis* | 1,067 | 53.7 | ||
Plaid Cymru | John Thomas Jones | 919 | 46.3 | ||
Majority | |||||
Turnout | |||||
Liberal hold | Swing |
Party | Candidate | Votes | % | ± | |
---|---|---|---|---|---|
Independent | Richard Wynn Cowell | 1,017 | |||
Plaid Cymru | Edward Vernon Jones | 881 | |||
Majority | |||||
Turnout | |||||
Independent gain from Liberal | Swing | ||||
Party | Candidate | Votes | % | ± | |
---|---|---|---|---|---|
Plaid Cymru | Griffith Gwynfor Jones | 957 | 46.7 | ||
Liberal | Glyndwr Lloyd Edwards | 638 | 31.2 | ||
Labour | Frederick Fanstone | 453 | 22.1 | ||
Majority | |||||
Turnout | |||||
Plaid Cymru gain from Labour | Swing | ||||
Party | Candidate | Votes | % | ± | |
---|---|---|---|---|---|
Independent | Rowland Ll. Peregrine* | 1,098 | 77.1 | ||
Plaid Cymru | Islwyn Iago | 327 | 22.9 | ||
Majority | |||||
Turnout | |||||
Independent hold | Swing |
Party | Candidate | Votes | % | ± | |
---|---|---|---|---|---|
Independent | R.G. Daniel | 1,166 | 69.8 | ||
Plaid Cymru | J. Jones | 504 | 30.2 | ||
Majority | |||||
Turnout | |||||
Independent hold | Swing |
Party | Candidate | Votes | % | ± | |
---|---|---|---|---|---|
Independent | D.G.E. Davies* | 1,794 | 81.2 | ||
Independent | G. Guttridge | 416 | 18.8 | ||
Majority | |||||
Turnout | |||||
Independent hold | Swing |
Party | Candidate | Votes | % | ± | |
---|---|---|---|---|---|
Independent | Hywel Heulyn Roberts* | Unopposed | |||
Independent hold |
Party | Candidate | Votes | % | ± | |
---|---|---|---|---|---|
Liberal | R.E. Morris* | 1,522 | 78.7 | ||
Plaid Cymru | T. George | 411 | 21.3 | ||
Majority | |||||
Turnout | |||||
Liberal hold | Swing |
Party | Candidate | Votes | % | ± | |
---|---|---|---|---|---|
Plaid Cymru | Marie James | 1,267 | 56.9 | ||
Independent | William Gethin Bennett | 958 | 43.1 | ||
Majority | |||||
Turnout | |||||
Plaid Cymru gain from Liberal | Swing | ||||
Party | Candidate | Votes | % | ± | |
---|---|---|---|---|---|
Labour | David Howard Cooke* | Unopposed | |||
Labour hold |
Party | Candidate | Votes | % | ± | |
---|---|---|---|---|---|
Labour | Myrddin Evans* | 1,193 | 66.1 | -9.9 | |
Plaid Cymru | D.H. Davies | 613 | 33.9 | +9.9 | |
Majority | 580 | 32.2 | -19.8 | ||
Turnout | |||||
Labour hold | Swing |
Party | Candidate | Votes | % | ± | |
---|---|---|---|---|---|
Labour | John Raglan Thomas* | 1,062 | |||
Liberal | Kenneth Denver Rees | 351 | |||
Plaid Cymru | Brian Marke | 204 | |||
Majority | |||||
Turnout | |||||
Labour hold | Swing |
-->
Party | Candidate | Votes | % | ± | |
---|---|---|---|---|---|
Labour | Thomas Elwyn Marks | 502 | 46.2 | -2.7 | |
Independent | Hugh Williams | 320 | 29.5 | 29.5 | |
Plaid Cymru | Edryd Morgan | 160 | 14.7 | -2.6 | |
Independent Labour | S.J.E. Samuel | 104 | 9.6 | +9.6 | |
Majority | 182 | 16.7 | +1.6 | ||
Turnout | |||||
Labour hold | Swing |
-->
Party | Candidate | Votes | % | ± | |
---|---|---|---|---|---|
Independent | Eirwen Jones-Parry* | 476 | 41.0 | -15.1 | |
Labour | Bryan Joseph Rayner | 432 | 37.2 | +6.8 | |
Plaid Cymru | Michael E. Clement | 254 | 21.8 | +8.3 | |
Majority | 44 | 3.8 | -21.9 | ||
Turnout | |||||
Independent hold | Swing |
Anthony Earle was elected at a by-election in 1975 following the death of T. Idwal Jones
-->
Party | Candidate | Votes | % | ± | |
---|---|---|---|---|---|
Labour | Anthony Earle* | 1,511 | 74.2 | ||
Plaid Cymru | Elizabeth Tabitha Beynon | 526 | 25.8 | ||
Majority | 985 | 48.4 | |||
Turnout | |||||
Labour hold | Swing |
Party | Candidate | Votes | % | ± | |
---|---|---|---|---|---|
Labour | Ellis James Powell* | 689 | |||
Plaid Cymru | Peter Hughes Griffiths | 376 | |||
Liberal | Janet Webb | 187 | |||
Majority | |||||
Turnout | |||||
Labour hold | Swing |
Party | Candidate | Votes | % | ± | |
---|---|---|---|---|---|
Independent | William Roy Nicholl* | 1,157 | |||
Plaid Cymru | Emrys Jones | 654 | |||
Majority | |||||
Turnout | |||||
Independent hold | Swing |
Party | Candidate | Votes | % | ± | |
---|---|---|---|---|---|
Ratepayer | William J. Wyn Evans | 1,142 | |||
Labour | Percy Morgan Lewis | 1,058 | |||
Independent | Jane Ann Jones | 645 | |||
Majority | |||||
Turnout | |||||
Ratepayer hold | Swing | ||||
Party | Candidate | Votes | % | ± | |
---|---|---|---|---|---|
Plaid Cymru | Handel Michael Ayres Williams | 788 | |||
Labour | David Gwynfor Charles* | 677 | |||
Independent Labour | Eira Cordelia Jones | 173 | |||
Majority | |||||
Turnout | |||||
Plaid Cymru gain from Labour | Swing | ||||
Party | Candidate | Votes | % | ± | |
---|---|---|---|---|---|
Independent | E.T. Davies* | Unopposed | |||
Independent hold |
Party | Candidate | Votes | % | ± | |
---|---|---|---|---|---|
Independent | J. Arthur J. Harries* | Unopposed | |||
Independent hold |
Party | Candidate | Votes | % | ± | |
---|---|---|---|---|---|
Independent | Dr William Edmund V.J. Davies* | 1,683 | |||
Independent | David Myrddin Jenkins | 1,018 | |||
Majority | |||||
Turnout | |||||
Independent hold | Swing |
Party | Candidate | Votes | % | ± | |
---|---|---|---|---|---|
Independent | J.L. James* | Unopposed | |||
Independent hold |
Party | Candidate | Votes | % | ± | |
---|---|---|---|---|---|
Independent | Clodwyn Percival Phillips | 1,301 | |||
Plaid Cymru | Daniel James Roy Llewellyn | 1,175 | |||
Majority | |||||
Turnout | |||||
Independent gain from Plaid Cymru | Swing | ||||
Party | Candidate | Votes | % | ± | |
---|---|---|---|---|---|
Labour | W.J. Davies | 977 | 60.3 | ||
Plaid Cymru | John Edwin Lewis | 848 | 39.7 | ||
Majority | |||||
Turnout | |||||
Labour hold | Swing |
Party | Candidate | Votes | % | ± | |
---|---|---|---|---|---|
Labour | Arthur Cledwyn Francis* | 1,106 | 65.9 | ||
Plaid Cymru | D. Rhys | 420 | 25.0 | ||
Communist | R.E. Hitchon | 153 | 9.1 | ||
Majority | 40.9 | ||||
Turnout | 37.4 | ||||
Labour hold | Swing |
Party | Candidate | Votes | % | ± | |
---|---|---|---|---|---|
Independent | Irwyn Phillips* | 1,034 | |||
Labour | D. Thomas | 383 | |||
Majority | |||||
Turnout | |||||
Independent hold | Swing |
Party | Candidate | Votes | % | ± | |
---|---|---|---|---|---|
Independent | W.D.R. Davies* | 1,125 | |||
Independent | T. Davies | 884 | |||
Independent | H. Jones | 537 | |||
Majority | |||||
Turnout | |||||
Independent hold | Swing |
Party | Candidate | Votes | % | ± | |
---|---|---|---|---|---|
Independent | D.T. Davies* | Unopposed | |||
Independent hold |
Party | Candidate | Votes | % | ± | |
---|---|---|---|---|---|
Labour | V.E.D. Price* | 1,472 | |||
Independent Socialist | D. Moses | 574 | |||
Majority | |||||
Turnout | |||||
Labour hold | Swing |
Party | Candidate | Votes | % | ± | |
---|---|---|---|---|---|
Labour | Roger Gareth Thomas* | 1,885 | |||
Plaid Cymru | J.G. James | 714 | |||
Majority | |||||
Turnout | |||||
Labour hold | Swing |
Party | Candidate | Votes | % | ± | |
---|---|---|---|---|---|
Independent | Gerald J. Earl* | 1,567 | |||
Labour | W. Davies | 1,043 | |||
Majority | |||||
Turnout | |||||
Independent hold | Swing |
Party | Candidate | Votes | % | ± | |
---|---|---|---|---|---|
Independent | Gwyn Jones | 1,172 | |||
Plaid Cymru | D. Jones | 1,112 | |||
Majority | 60 | ||||
Turnout | |||||
Independent hold | Swing |
Party | Candidate | Votes | % | ± | |
---|---|---|---|---|---|
Labour | I.L. Foulkes | Unopposed | |||
Labour hold |
Party | Candidate | Votes | % | ± | |
---|---|---|---|---|---|
Independent | Harry J. Richards* | 969 | |||
Labour | J. Smith | 437 | |||
Plaid Cymru | G. Morris | 364 | |||
Majority | |||||
Turnout | |||||
Independent hold | Swing |
Party | Candidate | Votes | % | ± | |
---|---|---|---|---|---|
Labour | Brinley Owen* | Unopposed | |||
Labour hold |
Party | Candidate | Votes | % | ± | |
---|---|---|---|---|---|
Labour | Grismond J. Williams* | 643 | |||
Plaid Cymru | D. Thomas | 312 | |||
Majority | |||||
Turnout | |||||
Labour hold | Swing |
Party | Candidate | Votes | % | ± | |
---|---|---|---|---|---|
Labour | Mrs M. Joseph | 455 | |||
Plaid Cymru | P. Davies | 429 | |||
Majority | |||||
Turnout | |||||
Labour hold | Swing |
Party | Candidate | Votes | % | ± | |
---|---|---|---|---|---|
Labour | David Chaeles Prothero | 354 | |||
Independent Labour | W.J. Davies* | 196 | |||
Majority | |||||
Turnout | |||||
Labour hold | Swing |
Party | Candidate | Votes | % | ± | |
---|---|---|---|---|---|
Labour | Harold J. Thomas | Unopposed | |||
Labour hold |
Party | Candidate | Votes | % | ± | |
---|---|---|---|---|---|
Labour | George M. McConkey* | Unopposed | |||
Labour hold |
Party | Candidate | Votes | % | ± | |
---|---|---|---|---|---|
Plaid Cymru | Hywel Teifi Edwards | 717 | |||
Labour | M.J. Thomas* | 632 | |||
Majority | |||||
Turnout | |||||
Plaid Cymru gain from Labour | Swing | ||||
Party | Candidate | Votes | % | ± | |
---|---|---|---|---|---|
Labour | David William James* | Unopposed | |||
Labour hold |
Party | Candidate | Votes | % | ± | |
---|---|---|---|---|---|
Labour | D.T. Enoch* | Unopposed | |||
Labour hold |
Party | Candidate | Votes | % | ± | |
---|---|---|---|---|---|
Independent | William Evans* | 2,113 | |||
Labour | Peter Appleton Wilde | 898 | |||
Majority | |||||
Turnout | |||||
Independent hold | Swing |
Party | Candidate | Votes | % | ± | |
---|---|---|---|---|---|
Independent | J. Evans* | Unopposed | |||
Independent hold |
Party | Candidate | Votes | % | ± | |
---|---|---|---|---|---|
Labour | Howard Jones* | Unopposed | |||
Labour hold |
Party | Candidate | Votes | % | ± | |
---|---|---|---|---|---|
Labour | Samuel T. Hughes* | Unopposed | |||
Labour hold |
Party | Candidate | Votes | % | ± | |
---|---|---|---|---|---|
Plaid Cymru | William Gwyn Hopkins | 693 | |||
Labour | G. Williams | 644 | |||
Majority | |||||
Turnout | |||||
Plaid Cymru gain from Labour | Swing | ||||
Party | Candidate | Votes | % | ± | |
---|---|---|---|---|---|
Independent | J. Jenkins* | 1,549 | 59.0 | ||
Plaid Cymru | C.M. Phillips | 1,075 | 41.0 | ||
Majority | 18.0 | ||||
Turnout | 68.4 | -2.3 | |||
Independent hold | Swing |
Party | Candidate | Votes | % | ± | |
---|---|---|---|---|---|
Independent | T.R. George* | Unopposed | |||
Independent hold |
Party | Candidate | Votes | % | ± | |
---|---|---|---|---|---|
Plaid Cymru | J.P.A. Maddocks | 757 | 51.6 | ||
Independent | Carey George* | 710 | 48.4 | ||
Majority | 3.2 | ||||
Turnout | 55.1 | +1.5 | |||
Plaid Cymru gain from Independent | Swing | ||||
Party | Candidate | Votes | % | ± | |
---|---|---|---|---|---|
Independent | J. Evans | 604 | 43.9 | ||
Labour | A. O'Brien | 406 | 29.5 | ||
Independent | G. Hughes | 367 | 26.7 | ||
Majority | 14.4 | ||||
Turnout | 56.9 | ||||
Independent hold | Swing |
Party | Candidate | Votes | % | ± | |
---|---|---|---|---|---|
Independent | T.G. Parry* | Unopposed | |||
Independent hold |
Party | Candidate | Votes | % | ± | |
---|---|---|---|---|---|
Independent | D.S. Grey* | Unopposed | |||
Independent hold |
Party | Candidate | Votes | % | ± | |
---|---|---|---|---|---|
Independent | A. Gray* | Unopposed | |||
Independent hold |
Party | Candidate | Votes | % | ± | |
---|---|---|---|---|---|
Independent | O.C. John* | Unopposed | |||
Independent hold |
Party | Candidate | Votes | % | ± | |
---|---|---|---|---|---|
Independent | J. James* | 1,249 | 66.9 | ||
Plaid Cymru | I. Williams | 619 | 33.1 | +33.1 | |
Majority | 33.7 | ||||
Turnout | 52.4 | ||||
Independent hold | Swing |
Party | Candidate | Votes | % | ± | |
---|---|---|---|---|---|
Independent | J. McBrearty | 784 | 93.4 | ||
Independent | B. Morris | 55 | 6.6 | ||
Majority | 86.9 | ||||
Turnout | 27.0 | -29.9 | |||
Independent hold | Swing |
Party | Candidate | Votes | % | ± | |
---|---|---|---|---|---|
Independent | H.W. Phillips* | Unopposed | |||
Independent hold |
Party | Candidate | Votes | % | ± | |
---|---|---|---|---|---|
Independent | R. Yolland* | Unopposed | |||
Independent hold |
Party | Candidate | Votes | % | ± | |
---|---|---|---|---|---|
Independent | Basil Ralph Woodruff* | Unopposed | |||
Independent hold |
Party | Candidate | Votes | % | ± | |
---|---|---|---|---|---|
Independent | Mrs R. Keane* | 467 | 52.4 | ||
Independent | T.W.H. Byard | 424 | 47.6 | ||
Majority | 4.8 | ||||
Turnout | 31.5 | ||||
Independent hold | Swing |
Party | Candidate | Votes | % | ± | |
---|---|---|---|---|---|
Independent | Thomas Elwyn John* | Unopposed | |||
Independent hold |
Party | Candidate | Votes | % | ± | |
---|---|---|---|---|---|
Independent | W. Harry* | 953 | 51.6 | +11.0 | |
Independent | R. Martin | 894 | 48.4 | ||
Majority | 3.2 | ||||
Turnout | 65.4 | -2.7 | |||
Independent hold | Swing |
Party | Candidate | Votes | % | ± | |
---|---|---|---|---|---|
Independent | David John Thomas* | Unopposed | |||
Independent hold |
Party | Candidate | Votes | % | ± | |
---|---|---|---|---|---|
Labour | J. John* | Unopposed | |||
Labour hold |
Party | Candidate | Votes | % | ± | |
---|---|---|---|---|---|
Independent | M. Mathias* | 1,091 | 71.9 | +44.6 | |
Plaid Cymru | R. Kane | 427 | 28.1 | +28.1 | |
Majority | 43.7 | ||||
Turnout | 43.7 | +1.1 | |||
Independent hold | Swing |
Party | Candidate | Votes | % | ± | |
---|---|---|---|---|---|
Independent | A. Dureau | 843 | |||
Independent | W. Corcoran | 290 | |||
Majority | |||||
Turnout | 22.8 | -10.4 | |||
Independent hold | Swing |
Party | Candidate | Votes | % | ± | |
---|---|---|---|---|---|
Labour | C.E. Nicholls* | Unopposed | |||
Labour hold |
Party | Candidate | Votes | % | ± | |
---|---|---|---|---|---|
Independent | Rev G.R. Ball* | Unopposed | |||
Independent hold |
Party | Candidate | Votes | % | ± | |
---|---|---|---|---|---|
Independent | W.G. Lawrence* | 594 | 41.7 | -11.3 | |
Independent | Norman Richard Parry | 411 | 28.8 | ||
Independent | M. Collis | 250 | 17.5 | ||
Independent | E. Hodgson | 161 | 12.0 | ||
Majority | 12.8 | ||||
Turnout | 54.9 | +2.7 | |||
Independent hold | Swing |
Party | Candidate | Votes | % | ± | |
---|---|---|---|---|---|
Independent | H. Mace | 845 | 55.2 | ||
Plaid Cymru | Wynne Islwyn Samuel | 686 | 44.8 | +44.8 | |
Majority | 10.4 | ||||
Turnout | 41.9 | ||||
Independent hold | Swing |
Beulah is a small village, wider community and electoral ward located halfway between the market town of Newcastle Emlyn and the seaside resort of Aberporth in Ceredigion, Wales.
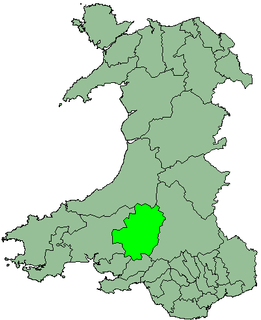
Dinefwr was a local government district of Dyfed, Wales from 1974 to 1996. It was named after Dinefwr Castle which was the court of the House of Dinefwr and one of the three principal royal courts of Wales with Aberffraw and Shrewsbury.
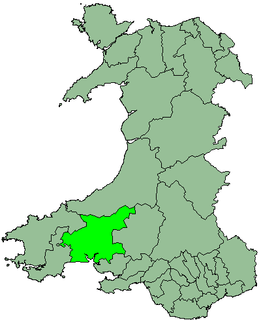
Carmarthen District Council was one of six local government districts of the county of Dyfed, west Wales, from 1974 to 1996. It was formed under the Local Government Act 1972 from the following parts of the administrative county of Carmarthenshire:
Elections to Durham County Council are held every four years. The council was created as part of the 1972 local government reforms. The first elections to the new authority were held in 1973 in advance of the council taking office in 1974. As part of changes to local government in 2009, the council became a unitary authority with the first elections to the new council taking place in 2008. Since becoming a unitary authority, 126 councillors have been elected from 63 wards.
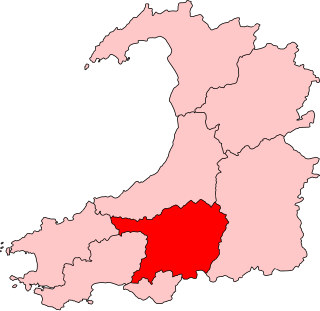
Carmarthen East and Dinefwr is a constituency of the National Assembly for Wales. It elects one Assembly Member by the first past the post method of election. Also, however, it is one of eight constituencies in the Mid and West Wales electoral region, which elects four additional members, in addition to eight constituency members, to produce a degree of proportional representation for the region as a whole.
Llanelli is a constituency of the National Assembly for Wales. It elects one Assembly Member by the first past the post method of election. Also, however, it is one of eight constituencies in the Mid and West Wales electoral region, which elects four additional members, in addition to eight constituency members, to produce a degree of proportional representation for the region as a whole.
The first election to Dyfed County Council was held in April 1973. It was followed by the 1977 election. The vast majority of the councillors elected had been members of one of the three previous county authorities which were merged to create Dyfed, namely Cardiganshire, Carmarthenshire, and Pembrokeshire.
The first elections to Pembrokeshire County Council was held on 4 May 1995. It was followed by the 1999 election. On the same day there were elections to the other 21 local authorities in Wales and community councils in Wales.
The second elections to the Carmarthenshire County Council were held in May 1999. It was preceded by the 1995 election and followed by the 2004 election. They resulted in a coalition between Independent councillors and Plaid Cymru for the next five years.
The third election to the Carmarthenshire County Council were held in May 2004. It was preceded by the 1999 election and followed by the 2008 election. As in previous elections, the Independent councillors had the largest number of seats. They resulted in a coalition between Independent and Labour Councillors for the next four years.
Carmarthen Town North is an electoral ward, representing part of the community of Carmarthen, Carmarthenshire, Wales.
Carmarthen Town South is an electoral ward, representing part of the community of Carmarthen, Carmarthenshire, Wales. Much of its southern border is defined by the River Towy, with the Carmarthen Town North and Carmarthen Town West wards to the north.
The first elections to the Ceredigion County Council were held on 4 May 1995. In the sense that the borders were identical, the election followed the 1991 election for Ceredigion District Council. It was followed by the 1999 election.
An election to the Carmarthenshire County Council was held on 9 April 1967. It was preceded by the 1967 election and was the last election prior to the reorganization of local government in Wales. Carmarthenshire County Council was merged with Cardiganshire and Pembrokeshire to form the new county of Dyfed and the first elections to the new authority were held in 1973.
The second election to Dyfed County Council was held in May 1981. It was preceded by the 1977 election and followed by the 1985 election. There were a number of unopposed returns, particularly in rural parts of the county.
The second election to Dyfed County Council was held in May 1985. It was preceded by the 1981 election and followed by the 1989 election. Once again, there were a number of unopposed returns, particularly in rural parts of the county..
The fifth election to Dyfed County Council was held in May 1989. It was preceded by the 1985 election and followed by the 1993 election. There were extensive boundary changes at this election.
The sixth and final election to Dyfed County Council was held in May 1993. It was preceded by the 1989 election. In 1995 Welsh local government reorganization led to the abolition of the authority.
Pembroke St Michael is the name of an electoral ward in the town of Pembroke, Pembrokeshire, Wales. It covers the east area of the town.