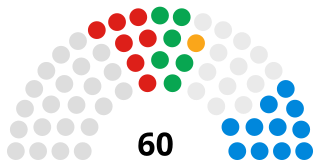
Elections to Pembrokeshire County Council were held on 1 May 2008. [1] It was preceded by the 2004 election and followed by the 2012 election. On the same day there were elections to the other 21 local authorities in Wales, and to community council elections in Wales. There were also elections elsewhere in the United Kingdom
Pembrokeshire County Council is the governing body for Pembrokeshire, one of the Principal Areas of Wales.
All 60 council seats were up for election. The previous council was controlled by Independents as had been the case since the authority was formed in 1995. The Independents retained control in 2008 and Labour achieved its worst result of the four elections fought thus far.
Party | Seats | Gains | Losses | Net gain/loss | Seats % | Votes % | Votes | +/− | |
---|---|---|---|---|---|---|---|---|---|
Labour | 5 | ||||||||
Conservative | 5 | ||||||||
Liberal Democrat | 3 | ||||||||
Plaid Cymru | 5 | ||||||||
Independent | 42 | ||||||||
Green | 0 |
Party | Candidate | Votes | % | ± | |
---|---|---|---|---|---|
Liberal Democrat | John Anthony Brinsden* | 354 | 66.2 | -1.5 | |
Conservative | Dilys Jenkinson | 181 | 33.8 | +33.8 | |
Majority | 173 | 32.4 | |||
Liberal Democrat hold | Swing |
Party | Candidate | Votes | % | ± | |
---|---|---|---|---|---|
Independent | Roger David Wildman* | unopposed | |||
Independent hold | Swing |
Party | Candidate | Votes | % | ± | |
---|---|---|---|---|---|
Independent | Jamie Adams* | Unopposed | |||
Independent hold | Swing |
Party | Candidate | Votes | % | ± | |
---|---|---|---|---|---|
Independent | David James Neale* | 301 | 54.5 | ||
Conservative | Nigel Birt-Llewellin | 136 | 24.6 | ||
Independent | Norman Richard Parry | 115 | 20.8 | ||
Majority | |||||
Independent hold | Swing |
Party | Candidate | Votes | % | ± | |
---|---|---|---|---|---|
Independent | John Thomas Davies* | unopposed | |||
Independent hold | Swing |
-->
Party | Candidate | Votes | % | ± | |
---|---|---|---|---|---|
Plaid Cymru | Rod Bowen* | Unopposed | |||
Plaid Cymru hold | Swing |
Party | Candidate | Votes | % | ± | |
---|---|---|---|---|---|
Independent | John Lynn Davies* | unopposed | |||
Independent hold | Swing |
Party | Candidate | Votes | % | ± | |
---|---|---|---|---|---|
Liberal Democrat | Bob Kilmister | 457 | 51.7 | ||
Independent | John Morgan Griffiths* | 325 | 36.8 | ||
Plaid Cymru | Iwan Brioc | 102 | 11.5 | ||
Majority | |||||
Liberal Democrat gain from Independent | Swing | ||||
Party | Candidate | Votes | % | ± | |
---|---|---|---|---|---|
Independent | Ernest James Codd* | unopposed | |||
Independent hold | Swing |
Party | Candidate | Votes | % | ± | |
---|---|---|---|---|---|
Independent | Myles Christopher Geary Pepper | 391 | 51.0 | ||
Conservative | James Thickitt | 189 | 24.6 | ||
Independent | Henry Walter Jones* | 187 | 24.4 | ||
Majority | |||||
Independent hold | Swing |
-->
Party | Candidate | Votes | % | ± | |
---|---|---|---|---|---|
Independent | Sian Elizabeth James* | 362 | 62.2 | ||
Independent | Richard Parry Davies | 220 | 37.8 | ||
Majority | |||||
Independent hold | Swing |
-->
Party | Candidate | Votes | % | ± | |
---|---|---|---|---|---|
Plaid Cymru | Gwendoline Moira Lewis | 285 | 41.7 | ||
Independent | Mike Lloyd | 232 | 34.0 | ||
Labour | Gwilym Price | 119 | 17.4 | ||
Conservative | Stephen Probert | 47 | 6.9 | ||
Majority | |||||
Plaid Cymru hold | Swing |
Party | Candidate | Votes | % | ± | |
---|---|---|---|---|---|
Labour | Thomas Baden Tudor* | 438 | 56.4 | ||
Conservative | Sarah Llewellyn | 338 | 43.6 | ||
Majority | 100 | ||||
Labour hold | Swing |
Party | Candidate | Votes | % | ± | |
---|---|---|---|---|---|
Independent | Lyndon Frayling | 282 | 57.7 | ||
Conservative | Chris Harries | 131 | 26.8 | ||
Independent | Roy Thomas | 76 | 15.5 | ||
Majority | |||||
Independent hold | Swing |
Party | Candidate | Votes | % | ± | |
---|---|---|---|---|---|
Independent | Peter Alan Stock* | unopposed | |||
Independent hold | Swing |
Party | Candidate | Votes | % | ± | |
---|---|---|---|---|---|
Independent | David Mark Edwards* | unopposed | |||
Independent hold | Swing |
Party | Candidate | Votes | % | ± | |
---|---|---|---|---|---|
Independent | David Michael Bryan* | 650 | 75.8 | ||
Independent | Steve Yelland | 207 | 24.2 | ||
Majority | |||||
Independent hold | Swing |
Party | Candidate | Votes | % | ± | |
---|---|---|---|---|---|
Independent | John Seymour Allen-Mierhouse* | unopposed | |||
Independent hold | Swing |
Ken Rowlands had been elected as a Labour candidate in 2004.
Party | Candidate | Votes | % | ± | |
---|---|---|---|---|---|
Independent | Kenneth Rowlands* | 480 | 72.8 | ||
Conservative | Rachael Murray-King | 179 | 27.2 | ||
Majority | |||||
Independent gain from Labour | Swing | ||||
Party | Candidate | Votes | % | ± | |
---|---|---|---|---|---|
Independent | David John Pugh | 483 | 58.5 | ||
Independent | John Scott Murphy* | 342 | 41.5 | ||
Majority | |||||
Independent hold | Swing |
Party | Candidate | Votes | % | ± | |
---|---|---|---|---|---|
Independent | David Simpson* | 427 | 70.0 | ||
Conservative | Jo Hammond | 183 | 30.0 | ||
Majority | |||||
Independent hold | Swing |
Party | Candidate | Votes | % | ± | |
---|---|---|---|---|---|
Independent | Clive John Collins* | unopposed | |||
Independent hold | Swing |
Party | Candidate | Votes | % | ± | |
---|---|---|---|---|---|
Independent | Thomas James Richards* | 344 | 39.2 | ||
Independent | Leonard Thomas | 292 | 33.3 | ||
Conservative | Priscilla Williams | 242 | 27.6 | ||
Majority | 52 | ||||
Independent hold | Swing |
Party | Candidate | Votes | % | ± | |
---|---|---|---|---|---|
Independent | Michael James John | 305 | 31.9 | ||
Independent | Pat Morris | 289 | 30.3 | ||
Independent | William Thomas | 279 | 29.2 | ||
Conservative | David Westrup | 82 | 8.6 | ||
Majority | 16 | ||||
Independent hold | Swing |
Party | Candidate | Votes | % | ± | |
---|---|---|---|---|---|
Independent | David William Mansel Rees* | 515 | 80.0 | ||
Conservative | Janet Waymont | 129 | 20.0 | ||
Majority | |||||
Independent hold | Swing |
Party | Candidate | Votes | % | ± | |
---|---|---|---|---|---|
Independent | Huw Meredydd George* | 674 | 55.2 | ||
Plaid Cymru | John Rhys Davies | 282 | 23.1 | ||
Conservative | Richard Griffiths | 265 | 21.7 | ||
Majority | 333 | ||||
Independent hold | Swing |
Party | Candidate | Votes | % | ± | |
---|---|---|---|---|---|
Independent | Lewis Malcolm Calver* | 353 | 36.0 | ||
Labour | Anthony Leonard Wales | 284 | 29.0 | ||
Independent | Ray Hughes | 192 | 19.6 | ||
Independent | Ray Hine | 99 | 10.1 | ||
Plaid Cymru | Paul Diment | 52 | 5.3 | ||
Majority | 69 | ||||
Independent hold | Swing |
Party | Candidate | Votes | % | ± | |
---|---|---|---|---|---|
Independent | Robert Mark Lewis* | unopposed | |||
Independent hold | Swing |
The winning candidate had stood for Labour in 2004.
Party | Candidate | Votes | % | ± | |
---|---|---|---|---|---|
Independent | Mary Umelda Havard* | 289 | 41.6 | ||
Independent | Cyril George Maurice Hughes | 203 | 29.3 | ||
Independent | Stephen Brown | 202 | 29.1 | ||
Majority | 86 | ||||
Independent gain from Labour | Swing | ||||
Party | Candidate | Votes | % | ± | |
---|---|---|---|---|---|
Independent | Anne Hughes* | 309 | 47.5 | ||
Liberal Democrat | Thomas Henry Sinclair | 177 | 27.2 | ||
Labour | Andrea Mills | 164 | 25.2 | ||
Majority | |||||
Independent hold | Swing |
-->
Party | Candidate | Votes | % | ± | |
---|---|---|---|---|---|
Independent | Danny Fellows | 215 | 41.3 | ||
Labour | Colin Robbins | 125 | 24.0 | ||
Independent | John Roberts | 107 | 20.5 | ||
Liberal Democrat | Tony Miles | 74 | 14.2 | ||
Majority | 90 | ||||
Independent hold | Swing |
Party | Candidate | Votes | % | ± | |
---|---|---|---|---|---|
Independent | Robert Michael Stoddart* | 432 | 56.5 | ||
Independent | Eric Ronald Harries | 253 | 33.1 | ||
Conservative | Fiona Birt-Llewellin | 80 | 10.5 | ||
Majority | |||||
Independent hold | Swing |
Party | Candidate | Votes | % | ± | |
---|---|---|---|---|---|
Independent | Vivien Stoddart | 276 | 47.4 | ||
Labour | Alun Emanuel Byrne* | 178 | 30.6 | ||
Conservative | John Lee | 128 | 22.0 | ||
Independent gain from Labour | Swing | ||||
Party | Candidate | Votes | % | ± | |
---|---|---|---|---|---|
Conservative | Stanley Thomas Hudson | 472 | 55.9 | ||
Labour | John William Cole* | 329 | 38.9 | ||
Liberal Democrat | James Gent | 44 | 5.2 | ||
Majority | |||||
Conservative gain from Labour | Swing | ||||
Party | Candidate | Votes | % | ± | |
---|---|---|---|---|---|
Plaid Cymru | David Rhys Sinnett* | 353 | 59.0 | ||
Labour | Carolyne Stevens | 160 | 26.8 | ||
Conservative | Jenelle Murray-King | 85 | 14.2 | ||
Majority | 190 | ||||
Plaid Cymru hold | Swing |
Party | Candidate | Votes | % | ± | |
---|---|---|---|---|---|
Independent | Wynne Edward Evans* | unopposed | |||
Independent hold | Swing |
Party | Candidate | Votes | % | ± | |
---|---|---|---|---|---|
Independent | Elwyn Morse | 353 | 52.2 | ||
Independent | Jayne Jones | 238 | 35.2 | ||
Conservative | Derek Williams | 85 | 12.6 | ||
Majority | 105 | ||||
Independent hold | Swing |
Party | Candidate | Votes | % | ± | |
---|---|---|---|---|---|
Independent | Robin Evans | 455 | 79.4 | ||
Plaid Cymru | Vicky Moller | 118 | 20.6 | ||
Majority | 337 | ||||
Independent hold | Swing |
Party | Candidate | Votes | % | ± | |
---|---|---|---|---|---|
Labour | Simon Leslie Hancock | 705 | 82.6 | ||
Conservative | Dorothy Morgan | 149 | 17.4 | ||
Labour hold | Swing |
Party | Candidate | Votes | % | ± | |
---|---|---|---|---|---|
Independent | Maureen Molyneaux | 232 | 35.6 | ||
Labour | Philip Walker | 184 | 28.3 | ||
Conservative | Michael Bryan | 149 | 22.9 | ||
Independent | Helen John | 86 | 13.2 | ||
Independent gain from Labour | Swing | ||||
Peral Llewellyn was elected as a Labour candidate in 2004.
Party | Candidate | Votes | % | ± | |
---|---|---|---|---|---|
Independent | Pearl Llewellyn* | 341 | 68.2 | ||
Labour | David Edwards | 97 | 19.4 | ||
Liberal Democrat | Keira Denise | 32 | 6.4 | ||
Independent | Keith John McNiffe | 30 | 6.0 | ||
Majority | 212 | ||||
Independent gain from Labour | Swing | ||||
Party | Candidate | Votes | % | ± | |
---|---|---|---|---|---|
Independent | William John Arwyn Williams* | 230 | 37.2 | ||
Labour | Tom Barrass | 196 | 31.7 | ||
Independent | Nikki Anderson | 140 | 22.6 | ||
Liberal Democrat | Stephanie Ashley | 53 | 8.6 | ||
Majority | 34 | ||||
Independent hold | Swing |
Party | Candidate | Votes | % | ± | |
---|---|---|---|---|---|
Independent | Rosalie Vera Lilwal* | 239 | 46.8 | ||
Conservative | Darren Richards | 118 | 23.1 | ||
Labour | Jane Margueritta Major | 100 | 19.6 | ||
Liberal Democrat | Alison Jones | 54 | 10.6 | ||
Majority | 121 | ||||
Independent hold | Swing |
Party | Candidate | Votes | % | ± | |
---|---|---|---|---|---|
Conservative | Aden Arthur Brinn | 527 | 51.9 | ||
Liberal Democrat | Gareth Jones | 384 | 37.8 | ||
Plaid Cymru | Eirug Roberts | 104 | 10.2 | ||
Majority | 143 | ||||
Conservative gain from Liberal Democrat | Swing | ||||
Party | Candidate | Votes | % | ± | |
---|---|---|---|---|---|
Labour | Linda Becton* | 274 | 62.8 | ||
Conservative | Maureen Colgon | 162 | 37.2 | ||
Majority | 112 | ||||
Labour hold | Swing |
Party | Candidate | Votes | % | ± | |
---|---|---|---|---|---|
Labour | Susan Perkins* | 416 | 48.2 | ||
Conservative | Darren Esmond | 236 | 27.3 | ||
Independent | Steven Lade | 211 | 24.2 | ||
Majority | 180 | ||||
Labour hold | Swing |
Party | Candidate | Votes | % | ± | |
---|---|---|---|---|---|
Independent | Brian John Hall* | 274 | 44.8 | ||
Labour | Christine Gwyther | 235 | 38.4 | ||
Independent | Steve Bale | 103 | 16.8 | ||
Majority | 39 | ||||
Independent hold | Swing |
Party | Candidate | Votes | % | ± | |
---|---|---|---|---|---|
Labour | Anthony Wilcox* | 669 | 61.7 | ||
Independent | Martin Cavaney | 327 | 30.1 | ||
Independent | Sue Bale | 89 | 8.2 | ||
Majority | |||||
Labour hold | Swing |
Party | Candidate | Votes | % | ± | |
---|---|---|---|---|---|
Plaid Cymru | Carol Cavill* | 410 | 66.1 | ||
Conservative | Di Clements | 210 | 33.9 | ||
Majority | 200 | ||||
Plaid Cymru hold | Swing |
Party | Candidate | Votes | % | ± | |
---|---|---|---|---|---|
Conservative | Richard Hancock | 417 | 51.4 | ||
Independent | David Islwyn Howells* | 395 | 48.6 | ||
Majority | 22 | ||||
Conservative gain from Independent | Swing | ||||
Party | Candidate | Votes | % | ± | |
---|---|---|---|---|---|
Independent | David George* | 399 | 45.8 | ||
Independent | David Gareth Beechey Lloyd | 229 | 26.3 | ||
Conservative | Debra Murphy | 147 | 16.9 | ||
Labour | Alan York | 96 | 11.0 | ||
Majority | 170 | ||||
Independent hold | Swing |
Party | Candidate | Votes | % | ± | |
---|---|---|---|---|---|
Liberal Democrat | Liz Campion | 677 | 61.7 | ||
Independent | David Griffith Michael James | 421 | |||
Majority | 256 | ||||
Liberal Democrat gain from Independent | Swing | ||||
Party | Candidate | Votes | % | ± | |
---|---|---|---|---|---|
Independent | Martin Davies | 336 | 57.6 | ||
Independent | William Joseph Roberts* | 247 | 42.4 | ||
Majority | 89 | ||||
Independent hold | Swing |
Rosemary Hayes was one of the longest serving members of the Council, having represented Saundersfoot on the authority since 1995 and previously been the district councillor on the former South Pembrokeshire District Council for many years. Phil Baker had stood as a Liberal Democrat in 2004.
Party | Candidate | Votes | % | ± | |
---|---|---|---|---|---|
Independent | Philip Raymond Baker | 549 | 57.6 | ||
Independent | Rosemary Rebecca Hayes* | 404 | 42.4 | ||
Majority | 145 | ||||
Independent hold | Swing |
Alwyn Luke was one of the longest serving members of the Council, having represented Scleddau on the authority since 1995 and previously been the district councillor on the former Preseli Pembrokeshire District Council for many years. David Williams had stood as a Liberal Democrat in 2008.
Party | Candidate | Votes | % | ± | |
---|---|---|---|---|---|
Conservative | Owen Watkin James | 219 | 35.2 | ||
Independent | Alwyn Cadwallader Luke* | 167 | 26.8 | ||
Independent | Jeff Evans | 125 | 20.1 | ||
Independent | David Williams | 87 | 14.0 | ||
Independent | Chris Haden | 24 | 3.9 | ||
Majority | 52 | ||||
Independent hold | Swing |
Party | Candidate | Votes | % | ± | |
---|---|---|---|---|---|
Independent | William Leslie Raymond* | 465 | 76.1 | ||
Labour | Mollie Roach | 146 | 23.9 | ||
Majority | 319 | ||||
Independent hold | Swing |
Party | Candidate | Votes | % | ± | |
---|---|---|---|---|---|
Plaid Cymru | Michael Williams* | 606 | 75.3 | ||
Independent | Sue Lane | 104 | 12.9 | ||
Conservative | Jill King | 95 | 11.8 | ||
Majority | 502 | ||||
Plaid Cymru hold | Swing |
Party | Candidate | Votes | % | ± | |
---|---|---|---|---|---|
Independent | Michael Evans | unopposed | |||
Independent hold | Swing |
Party | Candidate | Votes | % | ± | |
---|---|---|---|---|---|
Independent | Peter Morgan | 262 | 34.6 | ||
Independent | Gordon Main | 234 | 30.9 | ||
Conservative | Frank Elliott | 130 | 17.2 | ||
Independent | Herbie Scurlock | 98 | 12.9 | ||
Liberal Democrat | David Gardner | 34 | 4.5 | ||
Majority | 28 | ||||
Independent hold | Swing |
Party | Candidate | Votes | % | ± | |
---|---|---|---|---|---|
Conservative | David Howlett | 411 | 52.8 | ||
Independent | Bobbie Sheldrake | 368 | 47.2 | ||
Majority | |||||
Conservative gain from Independent | Swing | ||||
Sketty is the name of an electoral ward in the City and County of Swansea, Wales, UK. The electoral ward is coterminous with the community.
Elections to Slough Borough Council were held on 4 May 2006. One third of the council was up for election. This was the 121st Slough general local authority election since Slough became a local government unit in 1863.
An election to Slough Borough Council was held on 10 June 2004. The whole council was up for election. This was the 120th Slough general local authority election, since Slough became a local government unit in 1863, including both whole Council elections and elections by thirds.
The 2007 UK local government elections were held on 3 May 2007. These elections took place in most of England and all of Scotland. There were no local government elections in Wales though the Welsh Assembly had a general election on the same day. There were no local government elections in Northern Ireland. Just over half of English councils and almost all the Scottish councils began the counts on Friday, rather than Thursday night, because of more complex arrangements regarding postal votes.
Elections to the Borough Council in Slough, England, were held on 3 May 2007. One third of the council was up for election. This was the 122nd Slough general local authority election since Slough became a local government unit in 1863.
The elections to Ceredigion County Council were held on 1 May 2008 along with elections to other Welsh councils, plus the London Mayor and Assembly Elections, Metropolitan English councils and Non Metropolitan English councils elections. All 42 council seats are up for election. It was preceded by the 2004 election and followed by the 2012 election.
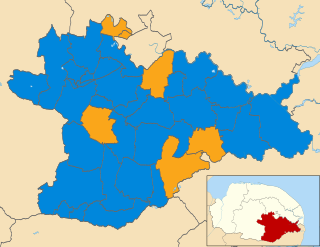
The elections to South Norfolk District Council were held on Thursday 5 May 2011 along with various other local elections around England, elections to the Scottish Parliament, National Assembly of Wales and Northern Ireland Assembly, and a referendum on whether to adopt the Alternative Vote electoral system for elections to the House of Commons. All 46 council seats were up for election. The previous council was controlled by the Conservatives, with the Liberal Democrats being the only opposition.
An election to Ceredigion County Council was held on 3 May 2012 along with elections to 20 of the other 21 local authorities in Wales, community council elections in Wales and other elections elsewhere in the United Kingdom. It was followed by the 2017 election.
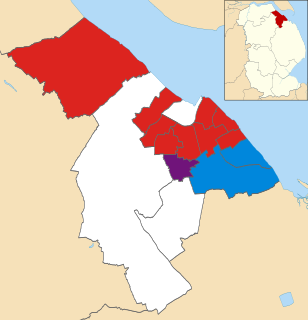
The 2012 North East Lincolnshire Council election took place on 3 May 2012 to elect members of North East Lincolnshire Council in England. This was on the same day as other United Kingdom local elections, 2012.
The first elections to Pembrokeshire County Council was held on 4 May 1995. It was followed by the 1999 election. On the same day there were elections to the other 21 local authorities in Wales and community councils in Wales.
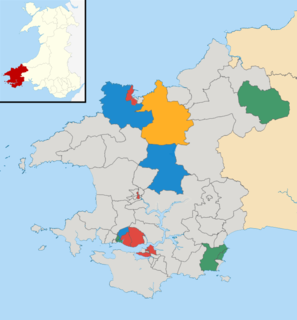
The fifth election to Pembrokeshire County Council was held on 3 May 2012. It was preceded by the 2008 election and followed by the 2017 election. On the same day there were elections to 20 of the other 21 local authorities in Wales, community council elections in Wales and other elections elsewhere in the United Kingdom
Elections to Pembrokeshire County Council were held on 10 June 2004. It was preceded by the 1999 election and followed by the 2008 election. The results were drawn from the Pembrokeshire County Council website but the relevant page has now (2013) been deleted. On the same day there were elections to the other 21 local authorities in Wales, and to community council elections in Wales. There were also elections elsewhere in the United Kingdom
The second elections to the Carmarthenshire County Council were held in May 1999. It was preceded by the 1995 election and followed by the 2004 election. They resulted in a coalition between Independent councillors and Plaid Cymru for the next five years.
Elections to Pembrokeshire County Council were held on 6 May 1999. It was preceded by the 1995 election and followed by the 2004 election. On the same day there were the first elections to the Welsh Assembly and elections to the other 21 local authorities in Wales and community councils in Wales.
Amroth is the name of an electoral ward in Pembrokeshire, Wales. It covers the community of Amroth which, as well as the village of Amroth included Summerhill, Stepaside, Pleasant Valley and Wiseman's Bridge and well as the hamlets at Llanteg and Llanteglos.
Carmarthen Town South is an electoral ward, representing part of the community of Carmarthen, Carmarthenshire, Wales. Much of its southern border is defined by the River Towy, with the Carmarthen Town North and Carmarthen Town West wards to the north.
The fifth election to the Carmarthenshire County Council was held on 1 May 2012. It was preceded by the 2008 election and was followed by the 2017 election. Plaid Cymru won 28 seats whilst Labour and the Independents won 23 each. The main feature of the election was a Labour recovery in the Llanelli area, and to some extent in the Gwendraeth and Ammanford area also, mainly at the expense of Independent candidates. Plaid Cymru lost ground to Labour in the Llanelli area but gained seats elsewhere, becoming the largest party. An Independent-Labour coalition was again formed, but with Labour as the leading partner. As a result, Kevin Madge replaced Meryl Gravell as the leader of the council.
The 2014 North East Lincolnshire Council election took place on 22 May 2014 to elect members of North East Lincolnshire Council in England. This was on the same day as other local elections. These elections saw UKIP making significant gains largely at the expense of Labour, and stripping them of their majority on the council.
Burton is the name of an electoral ward in Pembrokeshire, Wales. The ward consists of the communities, of Burton and Rosemarket. The community of Burton consists of part of Pembrokeshire Coast National Park
The 2018 Sunderland City Council election took place on 3 May 2018 to elect members of Sunderland City Council in England. The election took place on the same day as other local elections.