Global warming in Antarctica

Last updated
Antarctic Skin Temperature Trends between 1981 and 2007, based on thermal infrared observations made by a series of NOAA satellite sensors. Skin temperature trends do not necessarily reflect air temperature trends. Antarctic Temperature Trend 1981-2007.jpg
Antarctic Skin Temperature Trends between 1981 and 2007, based on thermal infrared observations made by a series of NOAA satellite sensors. Skin temperature trends do not necessarily reflect air temperature trends.

The effects of global warming in Antarctica may include rising temperatures and increasing snowmelt and ice loss. [1] A summary study in 2018 incorporating calculations and data from many other studies estimated that total ice loss was 43 gigatons per year on average during the period from 1992 to 2002 but has accelerated to an average of 220 gigatons per year during the five years from 2012 to 2017. [2]

Contents

Effects

The continent-wide average surface temperature trend of Antarctica is positive and significant at >0.05 °C/decade since 1957. [3] [4] [5] [6] The West Antarctic ice sheet has warmed by more than 0.1 °C/decade in the last 50 years, with most of the warming occurring in winter and spring. This is somewhat offset by cooling in East Antarctica during the fall. This effect is restricted to the 1980s and 1990s. [3] [4] [5]

Research published in 2009 found that overall the continent had become warmer since the 1950s, a finding consistent with the influence of man-made climate change:

"We can't pin it down, but it certainly is consistent with the influence of greenhouse gases from fossil fuels"',said NASA scientist Drew Shindell, another study co-author. Some of the effects also could be natural variability, he said. [7]

2000s

The British Antarctic Survey, which has undertaken the majority of Britain's scientific research in the area, had the following positions in 2006: [8]

September 20, 2007 NASA map showing previously un-melted snowmelt Antarctic Ice Melt-First Year.jpg
September 20, 2007 NASA map showing previously un-melted snowmelt

The area of strongest cooling appears at the South Pole, and the region of strongest warming lies along the Antarctic Peninsula. A possible explanation is that loss of UV-absorbing ozone may have cooled the stratosphere and strengthened the polar vortex, a pattern of spinning winds around the South Pole. The vortex acts like an atmospheric barrier, preventing warmer, coastal air from moving into the continent's interior. A stronger polar vortex might explain the cooling trend in the interior of Antarctica.

In their latest study (September 20, 2007) NASA researchers have confirmed that Antarctic snow is melting farther inland from the coast over time, melting at higher altitudes than ever and increasingly melting on Antarctica's largest ice shelf. [10]

There is also evidence for widespread glacier retreat around the Antarctic Peninsula. [11]

2010s

Researchers reported on December 21, 2012 in Nature Geoscience that from 1958 to 2010, the average temperature at the mile-high Byrd Station rose by 2.4 degrees Celsius, with warming fastest in its winter and spring. The spot which is in the heart of the West Antarctic Ice Sheet is one of the fastest-warming places on Earth. [12] [13] [14]

A study of the Antarctic Peninsula, a small subregion of Lesser Antarctica, published in 2017 found that the temperature trends at the northern tip of the Peninsula, the north-east region of the Peninsula, and the South Shetland Islands "shifted from a warming trend of 0.32 °C/decade during 1979–1997 to a cooling trend of -0.47 °C/decade during 1999–2014" but that this variation was absent from the south-west region of the Peninsula. [15]

A 2018 systematic review of all previous studies and data by the Ice Sheet Mass Balance Inter-comparison Exercise (IMBIE) found that Antarctica lost 2720 ± 1390 gigatons of ice during the period from 1992 to 2017, enough to contribute 7.6 millimeters to sea level rise once all detached icebergs melt. Most ice losses occurred in West Antarctica and the Antarctic Peninsula. The overall loss has substantially accelerated since the 2012 IMBIE assessment: an average loss of 43 gigatons per year during the first ten years, 1992 to 2002, rose to an average of 220 gigatons per year in the last 5 years. East Antarctica appears to have experienced a net gain of a relatively small amount of ice during the 25-years although uncertainty is greater due to subsidence of the underlying bedrock. [2]

Through his ongoing study, climate scientist, Nick Golledge, has estimated that Antarctic ice sheets will continue to melt and will have a profound effect on global climate. [16] According to Golledge's analysis, by the year 2100, 25 centimeters of water will have been added to the world's ocean, as water temperature continues to rise. [17]

2020s

A study made by a group of scientists in 2020, found that in the years 1989 - 2018 the south pole had warmed by 1.8°C, three times more that the global average. From this warming 0.8°C is due to natural cycles that can cause after similar cooling, but 1.0°C is from Climate Change. [18]

22 July: Scientists confirm the first active leak of sea-bed methane in Antarctica and report that "the rate of microbial succession may have an unrealized impact on greenhouse gas emission from marine methane reservoirs". Early succession of the Cinder Cones methane seep.jpg
22 July: Scientists confirm the first active leak of sea-bed methane in Antarctica and report that "the rate of microbial succession may have an unrealized impact on greenhouse gas emission from marine methane reservoirs".

Related Research Articles

Cryosphere Those portions of Earths surface where water is in solid form

The cryosphere is an all-encompassing term for those portions of Earth's surface where water is in solid form, including sea ice, lake ice, river ice, snow cover, glaciers, ice caps, ice sheets, and frozen ground. Thus, there is a wide overlap with the hydrosphere. The cryosphere is an integral part of the global climate system with important linkages and feedbacks generated through its influence on surface energy and moisture fluxes, clouds, precipitation, hydrology, atmospheric and oceanic circulation. Through these feedback processes, the cryosphere plays a significant role in the global climate and in climate model response to global changes. The term deglaciation describes the retreat of cryospheric features. Cryology is the study of cryospheres.

Climate of Antarctica

The climate of Antarctica is the coldest on Earth. The continent is also extremely dry, averaging 166 mm (6.5 in) of precipitation per year. Snow rarely melts on most parts of the continent, and, after being compressed, becomes the glacier ice that makes up the ice sheet. Weather fronts rarely penetrate far into the continent, because of the katabatic winds. Most of Antarctica has an ice-cap climate with very cold, generally extremely dry weather.

Ice sheet large mass of glacier ice

An ice sheet, also known as a continental glacier, is a mass of glacial ice that covers surrounding terrain and is greater than 50,000 km2 (19,000 sq mi). The only current ice sheets are in Antarctica and Greenland; during the last glacial period at Last Glacial Maximum (LGM) the Laurentide Ice Sheet covered much of North America, the Weichselian ice sheet covered northern Europe and the Patagonian Ice Sheet covered southern South America.

Antarctic Peninsula Peninsula located in northern Antarctica

The Antarctic Peninsula, known as O'Higgins Land in Chile and Tierra de San Martin in Argentina, and originally as the Palmer Peninsula in the US and Graham Land in the United Kingdom, is the northernmost part of the mainland of Antarctica.

West Antarctic Ice Sheet segment of the continental ice sheet that covers West (or Lesser) Antarctica

The Western Antarctic Ice Sheet (WAIS) is the segment of the continental ice sheet that covers West Antarctica, the portion of Antarctica on the side of the Transantarctic Mountains which lies in the Western Hemisphere. The WAIS is classified as a marine-based ice sheet, meaning that its bed lies well below sea level and its edges flow into floating ice shelves. The WAIS is bounded by the Ross Ice Shelf, the Ronne Ice Shelf, and outlet glaciers that drain into the Amundsen Sea.

Polar ice cap high-latitude region of an astronomical body (e.g. planet) with major parts covered in ice

A polar ice cap or polar cap is a high-latitude region of a planet, dwarf planet, or natural satellite that is covered in ice.

Antarctic ice sheet Polar ice cap

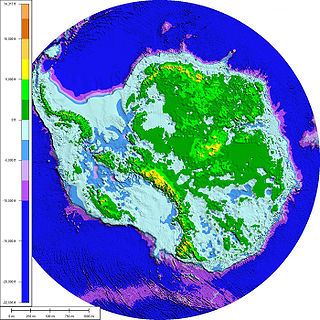
The Antarctic ice sheet is one of the two polar ice caps of the Earth. It covers about 98% of the Antarctic continent and is the largest single mass of ice on Earth. It covers an area of almost 14 million square kilometres and contains 26.5 million cubic kilometres of ice. A cubic kilometer of ice weighs approximately one metric gigaton, meaning that the ice sheet weighs 26,500,000 gigatons. Approximately 61 percent of all fresh water on the Earth is held in the Antarctic ice sheet, an amount equivalent to about 58 m of sea-level rise. In East Antarctica, the ice sheet rests on a major land mass, while in West Antarctica the bed can extend to more than 2,500 m below sea level.

The Greenland ice sheet is a vast body of ice covering 1,710,000 square kilometres (660,000 sq mi), roughly 79% of the surface of Greenland.

Global temperature record measurements & proxies

The global temperature record shows the fluctuations of the temperature of the atmosphere and the oceans through various spans of time. The most detailed information exists since 1850, when methodical thermometer-based records began. There are numerous estimates of temperatures since the end of the Pleistocene glaciation, particularly during the current Holocene epoch. Older time periods are studied by paleoclimatology.

Retreat of glaciers since 1850 Shortening of glaciers by melting

The retreat of glaciers since 1850 affects the availability of fresh water for irrigation and domestic use, mountain recreation, animals and plants that depend on glacier-melt, and, in the longer term, the level of the oceans. Studied by glaciologists, the temporal coincidence of glacier retreat with the measured increase of atmospheric greenhouse gases is often cited as an evidentiary underpinning of global warming. Mid-latitude mountain ranges such as the Himalayas, Rockies, Alps, Cascades, and the southern Andes, as well as isolated tropical summits such as Mount Kilimanjaro in Africa, are showing some of the largest proportionate glacial losses.

The Antarctic Cold Reversal (ACR) was an important episode of cooling in the climate history of the Earth during the deglaciation at the close of the last ice age. It illustrates the complexity of the climate changes at the transition from the Pleistocene to the Holocene Epochs.

Climate change in the Arctic The effects of global warming in the Arctic

The effects of global warming in the Arctic, or climate change in the Arctic include rising air and water temperatures, loss of sea ice, and melting of the Greenland ice sheet with a related cold temperature anomaly, observed since the 1970s. Related impacts include ocean circulation changes, increased input of freshwater, and ocean acidification. Indirect effects through potential climate teleconnections to mid latitudes may result in a greater frequency of extreme weather events, ecological, biological and phenology changes, biological migrations and extinctions, natural resource stresses and as well as human health, displacement and security issues. Potential methane releases from the region, especially through the thawing of permafrost and methane clathrates, may occur. Presently, the Arctic is warming twice as fast as the rest of the world. The pronounced warming signal, the amplified response of the Arctic to global warming, is often seen as a leading indicator of global warming. The melting of Greenland's ice sheet is linked to polar amplification. According to a study published in 2016, about 0.5 °C (0.90 °F) of the warming in the Arctic has been attributed to reductions in sulfate aerosols in Europe since 1980.

Antarctica cooling controversy Antarctica is the home of multiple legends and conspiracy theories.

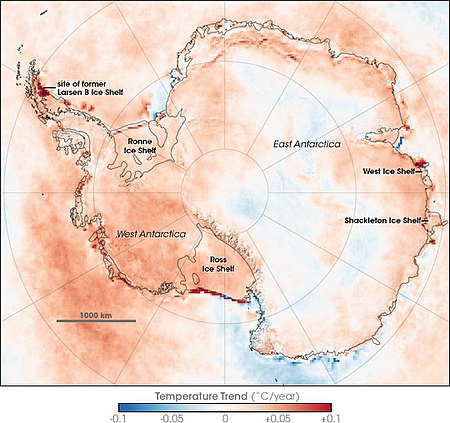
The Antarctica cooling controversy was the result of an apparent contradiction in the observed cooling behavior of Antarctica between 1966 and 2000 became part of the public debate in the global warming controversy, particularly between advocacy groups of both sides in the public arena including politicians, as well as the popular media. In his novel State of Fear, Michael Crichton asserted that the Antarctic data contradict global warming. The few scientists who have commented on the supposed controversy state that there is no contradiction, while the author of the paper whose work inspired Crichton's remarks has said that Crichton misused his results. There is no similar controversy within the scientific community, as the small observed changes in Antarctica are consistent with the small changes predicted by climate models, and because the overall trend since comprehensive observations began is now known to be one of warming.

East Antarctic Ice Sheet

The East Antarctic Ice Sheet (EAIS) is one of two large ice sheets in Antarctica, and the largest on the entire planet. The EAIS lies between 45° west and 168° east longitudinally.

Antarctica Continent

Antarctica is Earth's southernmost continent. It contains the geographic South Pole and is situated in the Antarctic region of the Southern Hemisphere, almost entirely south of the Antarctic Circle, and is surrounded by the Southern Ocean. At 14,200,000 square kilometres, it is the fifth-largest continent and nearly twice the size of Australia. At 0.00008 people per square kilometre, it is by far the least densely populated continent. About 98% of Antarctica is covered by ice that averages 1.9 km in thickness, which extends to all but the northernmost reaches of the Antarctic Peninsula.

Sea level rise The current long-term trend for sea levels to rise mainly in response to global warming

Since at least the start of the 20th century, the average global sea level has been rising. Between 1900 and 2016, the sea level rose by 16–21 cm (6.3–8.3 in). More precise data gathered from satellite radar measurements reveal an accelerating rise of 7.5 cm (3.0 in) from 1993 to 2017, which is a trend of roughly 30 cm (12 in) per century. This acceleration is due mostly to human-caused global warming, which is driving thermal expansion of seawater and the melting of land-based ice sheets and glaciers. Between 1993 and 2018, thermal expansion of the oceans contributed 42% to sea level rise; the melting of temperate glaciers, 21%; Greenland, 15%; and Antarctica, 8%. Climate scientists expect the rate to further accelerate during the 21st century.

Physical impacts of climate change

Climate change causes a variety of physical impacts on the climate system. The physical impacts of climate change foremost include globally rising temperatures of the lower atmosphere, the land, and oceans. Temperature rise is not uniform, with land masses and the Arctic region warming faster than the global average. Effects on weather encompass increased heavy precipitation, reduced amounts of cold days, increase in heat waves and various effects on tropical cyclones. The enhanced greenhouse effect causes the higher part of the atmosphere, the stratosphere, to cool. Geochemical cycles are also impacted, with absorption of CO
2
causing ocean acidification, and rising ocean water decreasing the ocean's ability to absorb further carbon dioxide. Annual snow cover has decreased, sea ice is declining and widespread melting of glaciers is underway. Thermal expansion and glacial retreat cause sea levels to increase. Retreat of ice mass may impact various geological processes as well, such as volcanism and earthquakes. Increased temperatures and other human interference with the climate system can lead to tipping points to be crossed such as the collapse of the thermohaline circulation or the Amazon rainforest. Some of these physical impacts also affect social and economic systems.

Antarctic sea ice The sea ice of the Southern Ocean

Antarctic sea ice is the sea ice of the Southern Ocean. It extends far north in winter and retreats almost to the coastline each summer. Sea ice is frozen seawater that is usually less than a few metres thick. This is in contrast to ice shelves, which are formed by glaciers, float in the sea, and are up to a kilometer thick. There are two subdivisions of sea ice: fast ice, which is attached to land; and ice floes, which are not.

The Ice Sheet Mass Balance Inter-comparison Exercise (IMBIE) is an international scientific collaboration attempting to improve estimates of the Antarctic and Greenland ice sheet contribution to sea level rise and to publish data and analyses concerning these subjects. IMBIE was founded in 2011 and is a collaboration between the European Space Agency (ESA) and the National Aeronautics and Space Administration (NASA) of the United States, and contributes to assessment reports of the Intergovernmental Panel on Climate Change (IPCC). IMBIE has led to improved confidence in the measurement of ice sheet mass balance and the associated global sea-level contribution. The improvements were achieved through combination of ice sheet imbalance estimates developed from the independent satellite techniques of altimetry, gravimetry and the input-output method. Going forwards, IMBIE provides a framework for assessing ice sheet mass balance, and has an explicit aim to widen participation to enable the entire scientific community to become involved.

Amelia E. Shevenell American marine geologist

Amelia E. Shevenell is an American marine geologist who specializes in high-latitude paleoclimatology and paleoceanography. She is currently an Associate Professor in the College of Marine Science at the University of South Florida. She has made notable contributions to understanding the history of the Antarctic ice sheets and published in high-impact journals and, as a result, was awarded full membership of Sigma Xi. She has a long record of participation in international ocean drilling programs and has served in leadership positions of these organizations. Shevenell is the elected Geological Oceanography Council Member for The Oceanography Society (2019-2021).

References

  1. The Danger of a Runaway Antarctica March 31, 2016,
  2. 1 2 Shepherd, Andrew; Ivins, Erik; et al. (IMBIE team) (2018-06-13). "Mass balance of the Antarctic Ice Sheet from 1992 to 2017" (PDF). Nature . 558 (7709): 219–222. Bibcode:2018Natur.558..219I. doi:10.1038/s41586-018-0179-y. PMID   29899482. Lay summary Ars Technica (2018-06-13).
  3. 1 2 Naumer, Tenney (21 January 2009). "Climate Change: The Next Generation: Eric J. Steig: Temperature in West Antarctica over the last 50 and 200 years".
  4. 1 2 Retrieved=2009-01-22 Archived December 29, 2008, at the Wayback Machine
  5. 1 2 Steig, Eric J.; Schneider, David P.; Rutherford, Scott D.; Mann, Michael E.; Comiso, Josefino C.; Shindell, Drew T. (22 January 2009). "Warming of the Antarctic ice-sheet surface since the 1957 International Geophysical Year". Nature. 457 (7228): 459–462. Bibcode:2009Natur.457..459S. doi:10.1038/nature07669. PMID   19158794.
  6. Ingham, Richard (21 January 2009). "Global warming hitting all of Antarctica: scientists". The Sydney Morning Herald.
  7. Antarctica study challenges warming skeptics, Jan 21, 2009,
  8. "Climate Change Positions". British Antarctic Survey. Archived from the original on February 7, 2006. Retrieved May 30, 2016.
  9. Wayman, Erin (24 April 2014). "In Antarctica, melting may beget ice".
  10. "NASA - NASA Researchers Find Snowmelt in Antarctica Creeping Inland". www.nasa.gov.
  11. IPCC 2007, Intergovernmental Panel on Climate Change, Climate Change 2007: The Physical Science Basis. Contribution of Working Group I to the Fourth Assessment Report of the Intergovernmental Panel on Climate Change, Cambridge University Press, 2007, page 376.
  12. West Antarctica warming fast; Temperature record from high-altitude station shows unexpectedly rapid rise December 21, 2012 Science News
  13. Bromwich, David H.; Nicolas, Julien P.; Monaghan, Andrew J.; Lazzara, Matthew A.; Keller, Linda M.; Weidner, George A.; Wilson, Aaron B. (23 December 2012). "Central West Antarctica among the most rapidly warming regions on Earth". Nature Geoscience. 6 (2): 139–145. Bibcode:2013NatGe...6..139B. CiteSeerX   10.1.1.394.1974 . doi:10.1038/ngeo1671.
  14. Bromwich, D. H.; Nicolas, J. P.; Monaghan, A. J.; Lazzara, M. A.; Keller, L. M.; Weidner, G. A.; Wilson, A. B. (2012). "Central West Antarctica among the most rapidly warming regions on Earth". Nature Geoscience . 6 (2): 139. Bibcode:2013NatGe...6..139B. CiteSeerX   10.1.1.394.1974 . doi:10.1038/ngeo1671.
  15. Oliva, M; Navarro, F; Hrbáček, F; Hernández, A; Nývltc, D (February 2017). P. Pereira, J. Ruiz-Fernández, R. Trigo. "Recent regional climate cooling on the Antarctic Peninsula and associated impacts on the cryosphere". Science of the Total Environment . 580: 210–223. doi:10.1016/j.scitotenv.2016.12.030. hdl: 10451/36205 . Retrieved May 1, 2017. The Antarctic Peninsula (AP) is often described as a region with one of the largest warming trends on Earth since the 1950s, based on the temperature trend of 0.54 °C/decade during 1951–2011 recorded at Faraday/Vernadsky station. Accordingly, most works describing the evolution of the natural systems in the AP region cite this extreme trend as the underlying cause of their observed changes. However, a recent analysis (Turner et al., 2016) has shown that the regionally stacked temperature record for the last three decades has shifted from a warming trend of 0.32 °C/decade during 1979–1997 to a cooling trend of − 0.47 °C/decade during 1999–2014. While that study focuses on the period 1979–2014, averaging the data over the entire AP region, we here update and re-assess the spatially-distributed temperature trends and inter-decadal variability from 1950 to 2015, using data from ten stations distributed across the AP region. We show that Faraday/Vernadsky warming trend is an extreme case, circa twice those of the long-term records from other parts of the northern AP. Our results also indicate that the cooling initiated in 1998/1999 has been most significant in the N and NE of the AP and the South Shetland Islands (> 0.5 °C between the two last decades), modest in the Orkney Islands, and absent in the SW of the AP. This recent cooling has already impacted the cryosphere in the northern AP, including slow-down of glacier recession, a shift to surface mass gains of the peripheral glacier and a thinning of the active layer of permafrost in northern AP islands.
  16. "Most dire projection of sea-level rise is a little less likely, reports say". Environment. 2019-02-06. Retrieved 2020-04-01.
  17. Golledge, Nicholas R.; Keller, Elizabeth D.; Gomez, Natalya; Naughten, Kaitlin A.; Bernales, Jorge; Trusel, Luke D.; Edwards, Tamsin L. (2019-02-06). "Global environmental consequences of twenty-first-century ice-sheet melt". Nature. 566 (7742): 65–72. doi:10.1038/s41586-019-0889-9. ISSN   1476-4687 . Retrieved 2020-04-02.
  18. Clem, Kyle (30 June 2020). "South pole warming three times faster than rest of the world, our research shows". The Guardian. Retrieved 1 July 2020.
  19. Carrington, Damian (21 July 2020). "First active leak of sea-bed methane discovered in Antarctica". The Guardian. Retrieved 16 August 2020.
  20. Thurber, Andrew R.; Seabrook, Sarah; Welsh, Rory M. (29 July 2020). "Riddles in the cold: Antarctic endemism and microbial succession impact methane cycling in the Southern Ocean". Proceedings of the Royal Society B: Biological Sciences. 287 (1931): 20201134. doi: 10.1098/rspb.2020.1134 . Retrieved 16 August 2020. CC-BY icon.svg Text and images are available under a Creative Commons Attribution 4.0 International License.