Guinsiliban | |
|---|---|
| Municipality of Guinsiliban | |
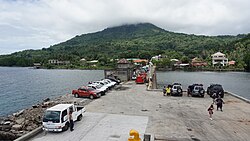 Guinsiliban Port | |
 Flag | |
 Map of Camiguin with Guinsiliban highlighted | |
OpenStreetMap  | |
 Guinsiliban Location within the Philippines | |
| Coordinates: 9°05′53″N124°47′10″E / 9.098°N 124.786°E | |
| Country | Philippines |
| Region | Northern Mindanao |
| Province | Camiguin |
| District | Lone district |
| Founded | June 13, 1950 |
| Barangays | 7 (see Barangays) |
| Government | |
| • Type | Sangguniang Bayan |
| • Mayor | Helenio N. Abecia (PDPLBN) |
| • Vice Mayor | Elvis O. Roxas (PDPLBN) |
| • Representative | Jurdin Jesus M. Romualdo |
| • Municipal Council | Members |
| • Electorate | 5,419 voters (2025) |
| Area | |
• Total | 18.52 km2 (7.15 sq mi) |
| Highest elevation | 676 m (2,218 ft) |
| Lowest elevation | 0 m (0 ft) |
| Population (2024 census) [3] | |
• Total | 6,827 |
| • Density | 370/km2 (950/sq mi) |
| • Households | 1,707 |
| Economy | |
| • Income class | 6th municipal income class |
| • Poverty incidence | 28.07 |
| • Revenue | ₱ 79.94 million (2022) |
| • Assets | ₱ 152.4 million (2022) |
| • Expenditure | ₱ 60.99 million (2022) |
| • Liabilities | ₱ 49.17 million (2022) |
| Service provider | |
| • Electricity | Camiguin Electric Cooperative (CAMELCO) |
| Time zone | UTC+8 (PST) |
| ZIP code | 9102 |
| PSGC | |
| IDD : area code | +63 (0)88 |
| Native languages | Kinamigin Cebuano Tagalog |
| Website | www |
Guinsiliban, officially the Municipality of Guinsiliban, is a municipality in the province of Camiguin, Philippines. According to the 2020 census, it has a population of 6,685 people, making it the least populated town in the province. [5]