Sagay | |
|---|---|
| Municipality of Sagay | |
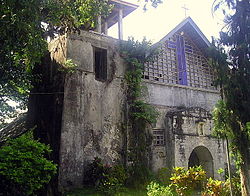 Sagay Church | |
 Flag | |
 Map of Camiguin with Sagay highlighted | |
OpenStreetMap  | |
 Sagay Location within the Philippines | |
| Coordinates: 9°07′N124°43′E / 9.12°N 124.72°E | |
| Country | Philippines |
| Region | Northern Mindanao |
| Province | Camiguin |
| District | Lone district |
| Founded | June 11, 1848 |
| Barangays | 9 (see Barangays) |
| Government | |
| • Type | Sangguniang Bayan |
| • Mayor | Joseph Go Uayan |
| • Vice Mayor | Neil John B. Yanco (PDPLBN) |
| • Representative | Jurdin Jesus M. Romualdo |
| • Municipal Council | Members |
| • Electorate | 9,240 voters (2025) |
| Area | |
• Total | 44.13 km2 (17.04 sq mi) |
| Elevation | 116 m (381 ft) |
| Population (2024 census) [3] | |
• Total | 13,192 |
| • Density | 300/km2 (770/sq mi) |
| • Households | 3,228 |
| Economy | |
| • Income class | 5th municipal income class |
| • Poverty incidence | 31.93 |
| • Revenue | ₱ 107.7 million (2022) |
| • Assets | ₱ 236.7 million (2022) |
| • Expenditure | ₱ 91.04 million (2022) |
| • Liabilities | ₱ 50.53 million (2022) |
| Service provider | |
| • Electricity | Camiguin Electric Cooperative (CAMELCO) |
| Time zone | UTC+8 (PST) |
| ZIP code | 9103 |
| PSGC | |
| IDD : area code | +63 (0)88 |
| Native languages | Kinamigin Cebuano Tagalog |
| Website | www |
Sagay, officially the Municipality of Sagay, is a municipality in the province of Camiguin, Philippines. According to the 2020 census, it has a population of 12,826 people. [5]