In information theory, the entropy of a random variable quantifies the average level of uncertainty or information associated with the variable's potential states or possible outcomes. This measures the expected amount of information needed to describe the state of the variable, considering the distribution of probabilities across all potential states. Given a discrete random variable , which takes values in the set and is distributed according to , the entropy is where denotes the sum over the variable's possible values. The choice of base for , the logarithm, varies for different applications. Base 2 gives the unit of bits, while base e gives "natural units" nat, and base 10 gives units of "dits", "bans", or "hartleys". An equivalent definition of entropy is the expected value of the self-information of a variable.

In probability theory and statistics, the multivariate normal distribution, multivariate Gaussian distribution, or joint normal distribution is a generalization of the one-dimensional (univariate) normal distribution to higher dimensions. One definition is that a random vector is said to be k-variate normally distributed if every linear combination of its k components has a univariate normal distribution. Its importance derives mainly from the multivariate central limit theorem. The multivariate normal distribution is often used to describe, at least approximately, any set of (possibly) correlated real-valued random variables, each of which clusters around a mean value.

In probability theory and statistics, the Bernoulli distribution, named after Swiss mathematician Jacob Bernoulli, is the discrete probability distribution of a random variable which takes the value 1 with probability and the value 0 with probability . Less formally, it can be thought of as a model for the set of possible outcomes of any single experiment that asks a yes–no question. Such questions lead to outcomes that are Boolean-valued: a single bit whose value is success/yes/true/one with probability p and failure/no/false/zero with probability q. It can be used to represent a coin toss where 1 and 0 would represent "heads" and "tails", respectively, and p would be the probability of the coin landing on heads. In particular, unfair coins would have

In probability theory and statistics, the beta distribution is a family of continuous probability distributions defined on the interval [0, 1] or in terms of two positive parameters, denoted by alpha (α) and beta (β), that appear as exponents of the variable and its complement to 1, respectively, and control the shape of the distribution.

In thermodynamics, the Helmholtz free energy is a thermodynamic potential that measures the useful work obtainable from a closed thermodynamic system at a constant temperature (isothermal). The change in the Helmholtz energy during a process is equal to the maximum amount of work that the system can perform in a thermodynamic process in which temperature is held constant. At constant temperature, the Helmholtz free energy is minimized at equilibrium.

In mathematics, Jensen's inequality, named after the Danish mathematician Johan Jensen, relates the value of a convex function of an integral to the integral of the convex function. It was proved by Jensen in 1906, building on an earlier proof of the same inequality for doubly-differentiable functions by Otto Hölder in 1889. Given its generality, the inequality appears in many forms depending on the context, some of which are presented below. In its simplest form the inequality states that the convex transformation of a mean is less than or equal to the mean applied after convex transformation.
In probability theory and statistics, the cumulantsκn of a probability distribution are a set of quantities that provide an alternative to the moments of the distribution. Any two probability distributions whose moments are identical will have identical cumulants as well, and vice versa.
In mathematics, the moments of a function are certain quantitative measures related to the shape of the function's graph. If the function represents mass density, then the zeroth moment is the total mass, the first moment is the center of mass, and the second moment is the moment of inertia. If the function is a probability distribution, then the first moment is the expected value, the second central moment is the variance, the third standardized moment is the skewness, and the fourth standardized moment is the kurtosis.

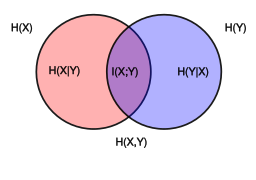
In probability theory and information theory, the mutual information (MI) of two random variables is a measure of the mutual dependence between the two variables. More specifically, it quantifies the "amount of information" obtained about one random variable by observing the other random variable. The concept of mutual information is intimately linked to that of entropy of a random variable, a fundamental notion in information theory that quantifies the expected "amount of information" held in a random variable.
In information theory, the information content, self-information, surprisal, or Shannon information is a basic quantity derived from the probability of a particular event occurring from a random variable. It can be thought of as an alternative way of expressing probability, much like odds or log-odds, but which has particular mathematical advantages in the setting of information theory.
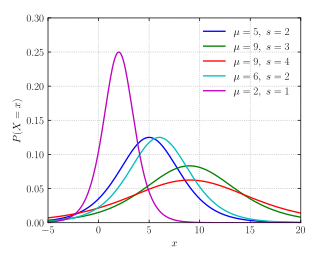
In probability theory and statistics, the logistic distribution is a continuous probability distribution. Its cumulative distribution function is the logistic function, which appears in logistic regression and feedforward neural networks. It resembles the normal distribution in shape but has heavier tails. The logistic distribution is a special case of the Tukey lambda distribution.
In mathematical statistics, the Fisher information is a way of measuring the amount of information that an observable random variable X carries about an unknown parameter θ of a distribution that models X. Formally, it is the variance of the score, or the expected value of the observed information.
Quantum statistical mechanics is statistical mechanics applied to quantum mechanical systems. In quantum mechanics a statistical ensemble is described by a density operator S, which is a non-negative, self-adjoint, trace-class operator of trace 1 on the Hilbert space H describing the quantum system. This can be shown under various mathematical formalisms for quantum mechanics.
In mathematical statistics, the Kullback–Leibler (KL) divergence, denoted , is a type of statistical distance: a measure of how one reference probability distribution P is different from a second probability distribution Q. Mathematically, it is defined as
In statistics and information theory, a maximum entropy probability distribution has entropy that is at least as great as that of all other members of a specified class of probability distributions. According to the principle of maximum entropy, if nothing is known about a distribution except that it belongs to a certain class, then the distribution with the largest entropy should be chosen as the least-informative default. The motivation is twofold: first, maximizing entropy minimizes the amount of prior information built into the distribution; second, many physical systems tend to move towards maximal entropy configurations over time.
Differential entropy is a concept in information theory that began as an attempt by Claude Shannon to extend the idea of (Shannon) entropy of a random variable, to continuous probability distributions. Unfortunately, Shannon did not derive this formula, and rather just assumed it was the correct continuous analogue of discrete entropy, but it is not. The actual continuous version of discrete entropy is the limiting density of discrete points (LDDP). Differential entropy is commonly encountered in the literature, but it is a limiting case of the LDDP, and one that loses its fundamental association with discrete entropy.
In mathematics, a π-system on a set is a collection of certain subsets of such that
In thermodynamics, the fundamental thermodynamic relation are four fundamental equations which demonstrate how four important thermodynamic quantities depend on variables that can be controlled and measured experimentally. Thus, they are essentially equations of state, and using the fundamental equations, experimental data can be used to determine sought-after quantities like G or H (enthalpy). The relation is generally expressed as a microscopic change in internal energy in terms of microscopic changes in entropy, and volume for a closed system in thermal equilibrium in the following way.
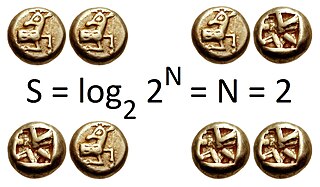
The mathematical theory of information is based on probability theory and statistics, and measures information with several quantities of information. The choice of logarithmic base in the following formulae determines the unit of information entropy that is used. The most common unit of information is the bit, or more correctly the shannon, based on the binary logarithm. Although "bit" is more frequently used in place of "shannon", its name is not distinguished from the bit as used in data-processing to refer to a binary value or stream regardless of its entropy Other units include the nat, based on the natural logarithm, and the hartley, based on the base 10 or common logarithm.
In probability theory and statistics, a cross-covariance matrix is a matrix whose element in the i, j position is the covariance between the i-th element of a random vector and j-th element of another random vector. A random vector is a random variable with multiple dimensions. Each element of the vector is a scalar random variable. Each element has either a finite number of observed empirical values or a finite or infinite number of potential values. The potential values are specified by a theoretical joint probability distribution. Intuitively, the cross-covariance matrix generalizes the notion of covariance to multiple dimensions.