Matawinie | |
---|---|
![]() | |
Coordinates: 46°16′N73°47′W / 46.267°N 73.783°W [1] | |
Country | ![]() |
Province | ![]() |
Region | Lanaudière |
Effective | January 1, 1982 |
County seat | Rawdon |
Government | |
• Type | Prefecture |
• Prefect | Gaétan Morin |
Area | |
• Total | 10,430.00 km2 (4,027.05 sq mi) |
• Land | 9,423.15 km2 (3,638.30 sq mi) |
Population (2021) [3] | |
• Total | 55,500 |
• Density | 5.9/km2 (15/sq mi) |
• Change 2016-2021 | ![]() |
• Dwellings | 37,357 |
Time zone | UTC−5 (EST) |
• Summer (DST) | UTC−4 (EDT) |
Area codes | 450 and 579 |
Website | www |
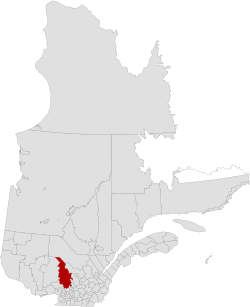
Matawinie (French pronunciation: [matawini] ) is a regional county municipality in the region of Lanaudière in southwestern Quebec, Canada. Its seat is Rawdon. The population according to the 2021 Canadian Census was 55,500. [3]
There are 27 subdivisions within the RCM: [2]
|
|
|
|
2021 | 2016 | 2011 | |
---|---|---|---|
Population | 55,500 (+10.0% from 2016) | 50,235 (+1.9% from 2011) | 49,516 (-0.4% from 2006) |
Land area | 9,423.15 km2 (3,638.30 sq mi) | 9,528.19 km2 (3,678.85 sq mi) | 9,527.58 km2 (3,678.62 sq mi) |
Population density | 5.9/km2 (15/sq mi) | 5.3/km2 (14/sq mi) | 5.2/km2 (13/sq mi) |
Median age | 54.4 (M: 54.4, F: 54.4) | 52.6 (M: 52.5, F: 52.8) | 49.4 (M: 49.3, F: 49.4) |
Private dwellings | 37,357 (total) 26,510 (occupied) | 35,858 (total) | 34,229 (total) |
Median household income | $62,000 | $32,697 | $43,708 |
|
| |||||||||||||||||||||||||||||||||
[7] [3] |
French and Atikamekw are the main languages.
Canada Census Mother Tongue - Matawinie Regional County Municipality, Quebec [7] [8] | ||||||||||||||||||
---|---|---|---|---|---|---|---|---|---|---|---|---|---|---|---|---|---|---|
Census | Total | French | English | French & English | Other | |||||||||||||
Year | Responses | Count | Trend | Pop % | Count | Trend | Pop % | Count | Trend | Pop % | Count | Trend | Pop % | |||||
2021 | 55,065 | 49,620 | ![]() | 90.1% | 1,825 | ![]() | 3.3% | 605 | ![]() | 1.1% | 2,845 | ![]() | 5.2% | |||||
2016 | 49,955 | 44,835 | ![]() | 89.8% | 1,855 | ![]() | 4.0% | 375 | ![]() | 0.6% | 2,890 | ![]() | 5.8% | |||||
2011 | 49,055 | 43,990 | ![]() | 89.7% | 1,975 | ![]() | 4.0% | 315 | ![]() | 0.6% | 2,775 | ![]() | 5.7% | |||||
2006 | 49,250 | 44,490 | ![]() | 90.3% | 1,590 | ![]() | 3.2% | 255 | ![]() | 0.5% | 2,915 | ![]() | 5.9% | |||||
2001 | 42,605 | 38,270 | ![]() | 89.8% | 1,800 | ![]() | 4.2% | 270 | ![]() | 0.6% | 2,265 | ![]() | 5.3% | |||||
1996 | 40,710 | 36,495 | n/a | 89.7% | 2,025 | n/a | 5.0% | 290 | n/a | 0.7% | 1,900 | n/a | 4.7% |
Highways and numbered routes that run through the municipality, including external routes that start or finish at the county border: [9]