
Code-division multiple access (CDMA) is a channel access method used by various radio communication technologies. CDMA is an example of multiple access, where several transmitters can send information simultaneously over a single communication channel. This allows several users to share a band of frequencies. To permit this without undue interference between the users, CDMA employs spread spectrum technology and a special coding scheme.
In cryptography, pseudorandom noise (PRN) is a signal similar to noise which satisfies one or more of the standard tests for statistical randomness. Although it seems to lack any definite pattern, pseudorandom noise consists of a deterministic sequence of pulses that will repeat itself after its period.

In signal processing, white noise is a random signal having equal intensity at different frequencies, giving it a constant power spectral density. The term is used with this or similar meanings in many scientific and technical disciplines, including physics, acoustical engineering, telecommunications, and statistical forecasting. White noise refers to a statistical model for signals and signal sources, not to any specific signal. White noise draws its name from white light, although light that appears white generally does not have a flat power spectral density over the visible band.
Geostatistics is a branch of statistics focusing on spatial or spatiotemporal datasets. Developed originally to predict probability distributions of ore grades for mining operations, it is currently applied in diverse disciplines including petroleum geology, hydrogeology, hydrology, meteorology, oceanography, geochemistry, geometallurgy, geography, forestry, environmental control, landscape ecology, soil science, and agriculture. Geostatistics is applied in varied branches of geography, particularly those involving the spread of diseases (epidemiology), the practice of commerce and military planning (logistics), and the development of efficient spatial networks. Geostatistical algorithms are incorporated in many places, including geographic information systems (GIS).

In signal processing, the power spectrum of a continuous time signal describes the distribution of power into frequency components composing that signal. According to Fourier analysis, any physical signal can be decomposed into a number of discrete frequencies, or a spectrum of frequencies over a continuous range. The statistical average of any sort of signal as analyzed in terms of its frequency content, is called its spectrum.

Active noise control (ANC), also known as noise cancellation (NC), or active noise reduction (ANR), is a method for reducing unwanted sound by the addition of a second sound specifically designed to cancel the first. The concept was first developed in the late 1930s; later developmental work that began in the 1950s eventually resulted in commercial airline headsets with the technology becoming available in the late 1980s. The technology is also used in road vehicles, mobile telephones, earbuds, and headphones.

In mathematics, a time series is a series of data points indexed in time order. Most commonly, a time series is a sequence taken at successive equally spaced points in time. Thus it is a sequence of discrete-time data. Examples of time series are heights of ocean tides, counts of sunspots, and the daily closing value of the Dow Jones Industrial Average.

Perlin noise is a type of gradient noise developed by Ken Perlin in 1983. It has many uses, including but not limited to: procedurally generating terrain, applying pseudo-random changes to a variable, and assisting in the creation of image textures. It is most commonly implemented in two, three, or four dimensions, but can be defined for any number of dimensions.
In audio engineering, electronics, physics, and many other fields, the color of noise or noise spectrum refers to the power spectrum of a noise signal. Different colors of noise have significantly different properties. For example, as audio signals they will sound different to human ears, and as images they will have a visibly different texture. Therefore, each application typically requires noise of a specific color. This sense of 'color' for noise signals is similar to the concept of timbre in music.

In electronics, noise is an unwanted disturbance in an electrical signal.

Simplex noise is the result of an n-dimensional noise function comparable to Perlin noise but with fewer directional artifacts, in higher dimensions, and a lower computational overhead. Ken Perlin designed the algorithm in 2001 to address the limitations of his classic noise function, especially in higher dimensions.
Simulation noise is a function that creates a divergence-free vector field. This signal can be used in artistic simulations for the purposes of increasing the perception of extra detail.

Value noise is a type of noise commonly used as a procedural texture primitive in computer graphics. It is conceptually different from, and often confused with gradient noise, examples of which are Perlin noise and Simplex noise. This method consists of the creation of a lattice of points which are assigned random values. The noise function then returns the interpolated number based on the values of the surrounding lattice points.

Gradient noise is a type of noise commonly used as a procedural texture primitive in computer graphics. It is conceptually different from, and often confused with, value noise. This method consists of a creation of a lattice of random gradients, dot products of which are then interpolated to obtain values in between the lattices. An artifact of some implementations of this noise is that the returned value at the lattice points is 0. Unlike the value noise, gradient noise has more energy in the high frequencies.
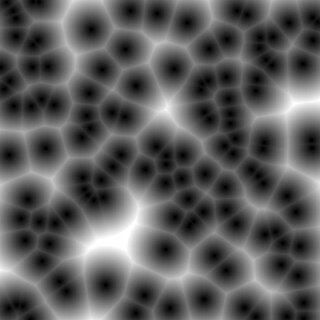
Worley noise, also called Voronoi noise and cellular noise, is a noise function introduced by Steven Worley in 1996. Worley noise is an extension of the Voronoi diagram that outputs a real value at a given coordinate that corresponds to the Distance of the nth nearest seed and the seeds are distributed evenly through the region. Worley noise is used to create procedural textures.
In geophysics, geology, civil engineering, and related disciplines, seismic noise is a generic name for a relatively persistent vibration of the ground, due to a multitude of causes, that is often a non-interpretable or unwanted component of signals recorded by seismometers.
In signal processing, noise is a general term for unwanted modifications that a signal may suffer during capture, storage, transmission, processing, or conversion.
Bayesian operational modal analysis (BAYOMA) adopts a Bayesian system identification approach for operational modal analysis (OMA). Operational modal analysis aims at identifying the modal properties (natural frequencies, damping ratios, mode shapes, etc.) of a constructed structure using only its (output) vibration response (e.g., velocity, acceleration) measured under operating conditions. The (input) excitations to the structure are not measured but are assumed to be 'ambient' ('broadband random'). In a Bayesian context, the set of modal parameters are viewed as uncertain parameters or random variables whose probability distribution is updated from the prior distribution (before data) to the posterior distribution (after data). The peak(s) of the posterior distribution represents the most probable value(s) (MPV) suggested by the data, while the spread of the distribution around the MPV reflects the remaining uncertainty of the parameters.

OpenSimplex noise is an n-dimensional gradient noise function that was developed in order to overcome the patent-related issues surrounding simplex noise, while likewise avoiding the visually-significant directional artifacts characteristic of Perlin noise.