North Carolina's 70th State House of Representatives district | |||
---|---|---|---|
![]() | |||
Representative |
| ||
Demographics | 73% White 7% Black 15% Hispanic 1% Asian 3% Multiracial | ||
Population (2020) | 88,156 |
North Carolina's 70th House district is one of 120 districts in the North Carolina House of Representatives. It has been represented by Republican Brian Biggs since 2023. [1]
Since 2005, the district has included part of Randolph County. The district overlaps with the 29th Senate district.
Representative | Party | Dates | Notes | Counties |
---|---|---|---|---|
District created January 1, 1985. | 1985–2003 Parts of Wilson, Edgecombe, and Nash counties. [2] [3] | |||
![]() Toby Fitch ( Wilson ) | Democratic | January 1, 1985 – December 29, 2001 | Resigned. | |
Vacant | December 29, 2001 – January 28, 2002 | |||
![]() Shelly Willingham ( Rocky Mount ) | Democratic | January 28, 2002 – January 1, 2003 | Appointed to finish Fitch's term. Redistricted to the 24th district and lost re-nomination. | |
Bobby Barbee ( Locust ) | Republican | January 1, 2003 – January 1, 2005 | Redistricted from the 82nd district. Redistricted to the 67th district and lost re-nomination. | 2003–2005 Parts of Stanly and Union counties. [4] |
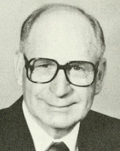
![]() Arlie Culp ( Ramseur ) | Republican | January 1, 2005 – January 1, 2007 | Redistricted from the 67th district. Retired. | 2005–Present Part of Randolph County. [5] [6] [7] [8] [9] [10] |
![]() Pat Hurley ( Asheboro ) | Republican | January 1, 2007 – January 1, 2023 | Lost re-nomination. | |
![]() Brian Biggs ( Trinity ) | Republican | January 1, 2023 – Present |
Party | Candidate | Votes | % | |
---|---|---|---|---|
Republican | Brian Biggs (incumbent) | 33,617 | 76.17% | |
Democratic | Susan Lee "Susie" Scott | 10,520 | 23.83% | |
Total votes | 44,137 | 100% | ||
Republican hold |
Party | Candidate | Votes | % | |
---|---|---|---|---|
Republican | Brian Biggs | 5,213 | 52.27% | |
Republican | Pat Hurley (incumbent) | 4,760 | 47.73% | |
Total votes | 9,973 | 100% |
Party | Candidate | Votes | % | |
---|---|---|---|---|
Republican | Brian Biggs | 22,160 | 79.01% | |
Democratic | Susan Lee "Susie" Scott | 5,887 | 20.99% | |
Total votes | 28,047 | 100% | ||
Republican hold |
Party | Candidate | Votes | % | |
---|---|---|---|---|
Republican | Pat Hurley (incumbent) | 28,546 | 75.87% | |
Democratic | Susan Lee "Susie" Scott | 9,080 | 24.13% | |
Total votes | 37,626 | 100% | ||
Republican hold |
Party | Candidate | Votes | % | |
---|---|---|---|---|
Republican | Pat Hurley (incumbent) | 18,717 | 76.91% | |
Democratic | Mary Rulli | 5,620 | 23.09% | |
Total votes | 24,337 | 100% | ||
Republican hold |
Party | Candidate | Votes | % | |
---|---|---|---|---|
Republican | Pat Hurley (incumbent) | 24,856 | 76.14% | |
Democratic | Lois Bohnsack | 7,789 | 23.86% | |
Total votes | 32,645 | 100% | ||
Republican hold |
Party | Candidate | Votes | % | |
---|---|---|---|---|
Republican | Pat Hurley (incumbent) | 15,508 | 100% | |
Total votes | 15,508 | 100% | ||
Republican hold |
Party | Candidate | Votes | % | |
---|---|---|---|---|
Republican | Pat Hurley (incumbent) | 24,642 | 100% | |
Total votes | 24,642 | 100% | ||
Republican hold |
Party | Candidate | Votes | % | |
---|---|---|---|---|
Republican | Pat Hurley (incumbent) | 3,252 | 69.83% | |
Republican | Fred Burgess | 1,405 | 30.17% | |
Total votes | 4,657 | 100% |
Party | Candidate | Votes | % | |
---|---|---|---|---|
Republican | Pat Hurley (incumbent) | 13,564 | 100% | |
Total votes | 13,564 | 100% | ||
Republican hold |
Party | Candidate | Votes | % | |
---|---|---|---|---|
Republican | Pat Hurley (incumbent) | 19,318 | 67.35% | |
Democratic | Bev O’Brien | 9,364 | 32.65% | |
Total votes | 28,682 | 100% | ||
Republican hold |
Party | Candidate | Votes | % | |
---|---|---|---|---|
Republican | Pat Hurley | 1,326 | 35.23% | |
Republican | Jim S. Parker | 1,317 | 34.99% | |
Republican | Lou Burrow Wilson | 1,121 | 29.78% | |
Total votes | 3,764 | 100% |
Party | Candidate | Votes | % | |
---|---|---|---|---|
Republican | Pat Hurley | 1,129 | 61.90% | |
Republican | Jim S. Parker | 695 | 38.10% | |
Total votes | 1,824 | 100% |
Party | Candidate | Votes | % | |
---|---|---|---|---|
Republican | Pat Hurley | 8,756 | 64.77% | |
Democratic | Hampton "Happy" Spivey | 4,762 | 35.23% | |
Total votes | 13,518 | 100% | ||
Republican hold |
Party | Candidate | Votes | % | |
---|---|---|---|---|
Republican | Arlie Culp (incumbent) | 2,036 | 53.01% | |
Republican | Jim Parker | 958 | 24.94% | |
Republican | Bucky Jernigan | 847 | 22.05% | |
Total votes | 3,841 | 100% |
Party | Candidate | Votes | % | |
---|---|---|---|---|
Republican | Arlie Culp (incumbent) | 19,578 | 91.58% | |
Libertarian | Douglas Kania | 1,801 | 8.42% | |
Total votes | 21,379 | 100% | ||
Republican hold |
Party | Candidate | Votes | % | |
---|---|---|---|---|
Republican | Bobby Barbee (incumbent) | 8,993 | 50.68% | |
Democratic | Max Melton | 8,751 | 49.32% | |
Total votes | 17,744 | 100% | ||
Republican hold |
Party | Candidate | Votes | % | |
---|---|---|---|---|
Democratic | Toby Fitch (incumbent) | 13,033 | 100% | |
Total votes | 13,033 | 100% | ||
Democratic hold |