Palliser (Saskatchewan electoral district)

Last updated

Palliser
Flag of Saskatchewan.svg Saskatchewan electoral district
Palliser, Sask riding.png
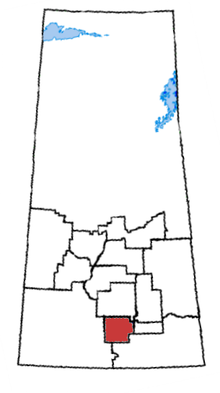
Palliser in relation to other Saskatchewan federal electoral districts
Coordinates: 50°10′59″N105°17′13″W / 50.183°N 105.287°W / 50.183; -105.287
Defunct federal electoral district
Legislature House of Commons
District created1996
District abolished2013
First contested 1997
Last contested 2011
District webpage profile, map
Demographics
Population (2011) [1] 68,544
Electors (2011)50,094
Area (km²) [2] 7,486.76
Census subdivision(s) Regina, Moose Jaw

Palliser was a federal electoral district in Saskatchewan, Canada, that was represented in the House of Commons of Canada from 1997 to 2015. It was named in honour of John Palliser, a geographer and explorer of the Canadian West.

Contents

Geography

It included the city of Moose Jaw, the southwest quadrant of the city of Regina and the rural areas around them.

History

The electoral district was created in 1996 from Moose Jaw—Lake Centre and parts of Regina—Lumsden, Regina—Wascana and Swift Current—Maple Creek—Assiniboia ridings.

The Conservative Party of Canada took back this historically New Democratic Party (NDP) seat in 2004.

Following the Canadian federal electoral redistribution, 2012, the riding was abolished. The Regina portion became part of the new riding of Regina—Lewvan, while Moose Jaw and the rural portion became part of Moose Jaw—Lake Centre—Lanigan. Small parts of the riding were transferred to Cypress Hills—Grasslands and Regina—Qu'Appelle.

Members of Parliament

ParliamentYearsMemberParty
Palliser
Riding created from Moose Jaw—Lake Centre, Regina—Lumsden,
Regina—Wascana and Swift Current—Maple Creek—Assiniboia
36th  1997–2000   Dick Proctor New Democratic
37th  2000–2004
38th  2004–2006   Dave Batters Conservative
39th  2006–2008
40th  2008–2011 Ray Boughen
41st  2011–2015
Riding dissolved into Moose Jaw—Lake Centre—Lanigan,
Cypress Hills—Grasslands, Regina—Lewvan and Regina—Qu'Appelle

Election results

2011 Canadian federal election
PartyCandidateVotes%±%Expenditures
Conservative Ray Boughen 15,85047.00+3.01$79,591
New Democratic Noah Evanchuk15,08444.73+10.96$68,063
Liberal Russell Collicott1,7975.33-11.72$23,336
Green Larissa Shasko9952.95-2.23$921
Total valid votes/expense limit33,726 100.00 $80,114
Total rejected ballots 93 0.27-0.13
Turnout 33,819 68.51+4.51
Eligible voters 49,362
2008 Canadian federal election
PartyCandidateVotes%±%Expenditures
Conservative Ray Boughen 14,15943.99+1.01$65,034
New Democratic Don Mitchell 10,86533.77+0.73$63,072
Liberal Calvin Johnston 5,48917.05-3.15$60,000
Green Larissa Shasko1,5805.18+1.78$213
Total valid votes/expense limit 32,093 100.00 $77,498
Total rejected ballots143 0.4
Turnout32,23664-5
2006 Canadian federal election
PartyCandidateVotes%±%Expenditures
Conservative Dave Batters 14,90642.98+7.13$71,895
New Democratic Jo-Anne Dusel11,40033.04-2.43$63,803
Liberal John Williams7,00620.20-4.61$35,782
Green Larissa Shasko1,1823.40+0.91$550
Canadian Action Marcia Fogal1200.34
Total valid votes/expense limit34,614100.00 
Total rejected ballots
Turnout34,61469.1 +4.7
2004 Canadian federal election
PartyCandidateVotes%±%Expenditures
Conservative Dave Batters 11,90935.85-5.59$69,479
New Democratic Dick Proctor 11,78535.47-2.68$62,385
Liberal John Williams8,24424.81+4.40$41,057
Green Brian Rands8292.49
Christian Heritage Harold Stephan4511.35$720
Total valid votes/expense limit33,218100.00 
Total rejected ballots1080.32+0.01
Turnout33,32664.42 -0.32

Note: Conservative vote is compared to the total of Progressive Conservative and Canadian Alliance vote in 2000.

2000 Canadian federal election
PartyCandidateVotes%±%Expenditures
  New Democratic Party Dick Proctor 12,13638.15-0.06$54,888
Alliance Don Findlay11,92737.50+8.31$55,442
  Liberal Garry Johnson6,49220.41-2.66$60,150
  Progressive Conservative Brent Shirkey1,2483.92-4.53$1,603
Total valid votes31,803100.00
Total rejected ballots990.31-0.27
Turnout31,90262.74-4.51

Note: Canadian Alliance vote is compared to the Reform vote in 1997.

1997 Canadian federal election
PartyCandidateVotes%±%Expenditures
  New Democratic Party Dick Proctor 12,55338.21$49,066
Reform Alene Tanner9,59029.19$29,487
  Liberal Tony Merchant 7,57923.07$50,830
  Progressive Conservative Andy McDougall2,7778.45$10,066
  Natural Law Jack Heilman3501.06
Total valid votes32,846100.00
Total rejected ballots1930.58
Turnout33,04267.35

See also

References