The economy of Poland is an industrialised, mixed economy with a developed market that serves as the sixth-largest in the European Union by nominal GDP and fifth-largest by GDP (PPP). Poland boasts the extensive public services characteristic of most developed economies. Since 1988, Poland has pursued a policy of economic liberalisation but retained an advanced public welfare system. This includes universal free public healthcare and education, extensive provisions of free public childcare, and parental leave. The country is considered by many to be a successful post-communist state. It is classified as a high-income economy by the World Bank, ranking 20th worldwide in terms of GDP (PPP), 21st in terms of GDP (nominal), and 21st in the 2023 Economic Complexity Index.
Warsaw, officially the Capital City of Warsaw, is the capital and largest city of Poland. The metropolis stands on the River Vistula in east-central Poland. Its population is officially estimated at 1.86 million residents within a greater metropolitan area of 3.27 million residents, which makes Warsaw the 7th most-populous city in the European Union. The city area measures 517 km2 (200 sq mi) and comprises 18 districts, while the metropolitan area covers 6,100 km2 (2,355 sq mi). Warsaw is an alpha global city, a major cultural, political and economic hub, and the country's seat of government. It is also capital of the Masovian Voivodeship.
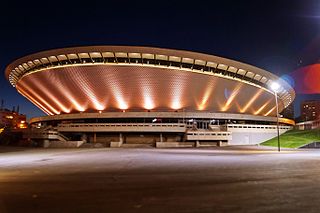
Katowice is the capital city of the Silesian Voivodeship in southern Poland and the central city of the Upper Silesian metropolitan area.

Real estate economics is the application of economic techniques to real estate markets. It tries to describe, explain, and predict patterns of prices, supply, and demand. The closely related field of housing economics is narrower in scope, concentrating on residential real estate markets, while the research on real estate trends focuses on the business and structural changes affecting the industry. Both draw on partial equilibrium analysis, urban economics, spatial economics, basic and extensive research, surveys, and finance.
A real-estate bubble or property bubble is a type of economic bubble that occurs periodically in local or global real estate markets, and it typically follows a land boom. A land boom is a rapid increase in the market price of real property such as housing until they reach unsustainable levels and then declines. This period, during the run-up to the crash, is also known as froth. The questions of whether real estate bubbles can be identified and prevented, and whether they have broader macroeconomic significance, are answered differently by schools of economic thought, as detailed below.

The Irish property bubble was the speculative excess element of a long-term price increase of real estate in the Republic of Ireland from the early 2000s to 2007, a period known as the later part of the Celtic Tiger. In 2006, the prices peaked at the top of the bubble, with a combination of increased speculative construction and rapidly rising prices; in 2007 the prices first stabilised and then started to fall until 2010 following the shock effect of the Great Recession. By the second quarter of 2010, house prices in Ireland had fallen by 35% compared with the second quarter of 2007, and the number of housing loans approved fell by 73%.

The Japanese asset price bubble was an economic bubble in Japan from 1986 to 1991 in which real estate and stock market prices were greatly inflated. In early 1992, this price bubble burst and Japan's economy stagnated. The bubble was characterized by rapid acceleration of asset prices and overheated economic activity, as well as an uncontrolled money supply and credit expansion. More specifically, over-confidence and speculation regarding asset and stock prices were closely associated with excessive monetary easing policy at the time. Through the creation of economic policies that cultivated the marketability of assets, eased the access to credit, and encouraged speculation, the Japanese government started a prolonged and exacerbated Japanese asset price bubble.

The Spanish property bubble is the collapsed overshooting part of a long-term price increase of Spanish real estate prices. This long-term price increase has happened in various stages from 1985 up to 2008. The housing bubble can be clearly divided in three periods: 1985–1991, in which the price nearly tripled; 1992–1996, in which the price remained somewhat stable; and 1996–2008, in which prices grew astonishingly again. Coinciding with the financial crisis of 2007–08, prices began to fall. In 2013, Raj Badiani, an economist at IHS Global Insight in London, estimated that the value of residential real estate has dropped more than 30 percent since 2007 and that house prices would fall at least 50 percent from the peak by 2015. Alcidi and Gros note; “If construction were to continue at the still relatively high rate of today, the process of absorption of the bubble would take more than 30 years”.

The construction industry of Iran is divided into two main sections. The first is government infrastructure projects, which are central for the cement industry. The second is the housing industry. In recent years, the construction industry has been thriving due to an increase in national and international investment to the extent that it is now the largest in the Middle East region. The Central Bank of Iran indicate that 70 percent of the Iranians own homes, with huge amounts of idle money entering the housing market. Iran has three shopping malls among the largest shopping malls in the world. Iran Mall is the largest shopping mall in the world, located in Tehran. The annual turnover in the construction industry amounts to US$38.4 billion. The real estate sector contributed to 5% of GDP in 2008. Statistics from March 2004 to March 2005 put the number of total Iranian households at 15.1 million and the total number of dwelling units at 13.5 million, signifying a demand for at least 5.1 million dwelling units. Every year there is a need for 750,000 additional units as young couples embark on married life. At present, 2000 units are being built every day although this needs to increase to 2740 units. Iran's construction market will expand to $154.4 billion in 2016 from $88.7 billion in 2013.

Złota 44 is a residential skyscraper in central Warsaw, Poland. It was designed by Polish-American architect Daniel Libeskind, in association with Polish architects Architecture. It was developed by US real estate investment manager Amstar and Warsaw developer BBI Development, which bought the topped-out but unfinished building from its initial developer, ORCO.
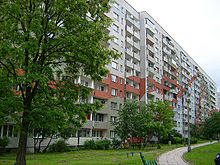
The Romanian property bubble was a real-estate bubble in Romania from the early 2000s to 2007. After the relative calm of the 1990s, since 2002 Romania has experienced a dramatic increase in property prices. Between 2002 and 2007, the median price for an old communist-era apartment rose by a factor of 10, from around €10,000 to c. €100,000. Today some apartments in central Bucharest have prices comparable with those of properties in Paris or London, and in virtually every small town the median housing price rivals that of similar towns in the European Union.

Orco Property Group S.A. is a real estate development company founded by Jean-François Ott based in Luxembourg, listed on the Euronext in Paris, Prague, Warsaw and Budapest Stock Exchange, it is a subsidiary of CPI Property Group.

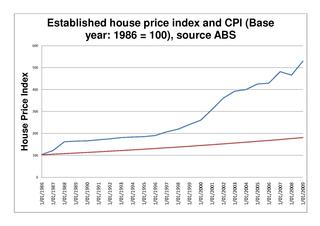
The Australian property market comprises the trade of land and its permanent fixtures located within Australia. The average Australian property price grew 0.5% per year from 1890 to 1990 after inflation, however rose from 1990 to 2017 at a faster rate. House prices in Australia receive considerable attention from the media and the Reserve Bank and some commentators have argued that there is an Australian property bubble.
The Australian property bubble is the economic theory that the Australian property market has become or is becoming significantly overpriced and due for a significant downturn. Since the early 2010s, various commentators, including one Treasury official, have claimed the Australian property market is in a significant bubble.

The 2005 Chinese property bubble was a real estate bubble in residential and commercial real estate in China. The New York Times reported that the bubble started to deflate in 2011, while observing increased complaints that members of the middle-class were unable to afford homes in large cities. The deflation of the property bubble is seen as one of the primary causes for China's declining economic growth in 2013.
The Lebanese housing bubble refers to an economic bubble affecting almost all of the Lebanese real estate sector, whereby property prices have risen exponentially since 2005, while the GDP has risen only around 52% during that same period.
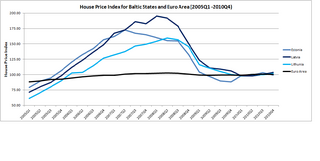
The Baltic states' housing bubble was an economic bubble involving major cities in Estonia, Latvia and Lithuania. The three Baltic countries had enjoyed a relatively strong economic growth between 2000 and 2006, and the real estate sectors had performed well since 2000. In fact, in between 2005Q1 and 2007Q1, the official house price index for Estonia, Latvia and Lithuania recorded a sharp jump of 104.6%, 134.3% and 106.7%. By comparison, the official house price index for Euro Area increased by 11.8% for a similar time period.
The property bubble in New Zealand is a major national economic and social issue. Since the early 1990s, house prices in New Zealand have risen considerably faster than incomes, putting increasing pressure on public housing providers as fewer households have access to housing on the private market. The property bubble has produced significant impacts on inequality in New Zealand, which now has one of the highest homelessness rate in the OECD and a record-high waiting list for public housing. Government policies have attempted to address the crisis since 2013, but have produced limited impacts to reduce prices or increase the supply of affordable housing. However, prices started falling in 2022 in response to tightening of mortgage availability and supply increasing. Some areas saw drops as high as around 9% - albeit from very high prices.

Housing in Azerbaijan is characterized by high rates of private housing ownership. Construction in housing industry started to improve in the late 1990s, as the result of the Presidential decree (1997), which eliminated the state monopoly of the construction sector.
The Canadian property bubble refers to a significant rise in Canadian real estate prices from 2002 to present which some observers have called a real estate bubble. The Dallas Federal reserve rated Canadian real estate as "exuberant" beginning in 2003. From 2003 to 2018, Canada saw an increase in home and property prices of up to 337% in some cities. In 2016, the OECD warned that Canada's financial stability was at risk due to elevated housing prices, investment and household debt. By 2018, home-owning costs were above 1990 levels when Canada saw its last housing bubble burst. Bloomberg Economics ranked Canada as the second largest housing bubble across the OECD in 2019 and 2021. Toronto scored the highest in the world in Swiss bank UBS' real estate bubble index in 2022, with Vancouver also scoring among the 10 riskiest cities in the world. By 2023 Canada’s nonfinancial debt exceeded 300% of GDP and household debt surpassed 100% of GDP, both higher than the levels seen in the United States before the 2008 global financial crisis.