
Remote sensing is the acquisition of information about an object or phenomenon without making physical contact with the object, in contrast to in situ or on-site observation. The term is applied especially to acquiring information about Earth and other planets. Remote sensing is used in numerous fields, including geophysics, geography, land surveying and most Earth science disciplines. It also has military, intelligence, commercial, economic, planning, and humanitarian applications, among others.
Ground truth is information that is known to be real or true, provided by direct observation and measurement as opposed to information provided by inference.

The Landsat program is the longest-running enterprise for acquisition of satellite imagery of Earth. It is a joint NASA / USGS program. On 23 July 1972, the Earth Resources Technology Satellite was launched. This was eventually renamed to Landsat 1 in 1975. The most recent, Landsat 9, was launched on 27 September 2021.

Synthetic-aperture radar (SAR) is a form of radar that is used to create two-dimensional images or three-dimensional reconstructions of objects, such as landscapes. SAR uses the motion of the radar antenna over a target region to provide finer spatial resolution than conventional stationary beam-scanning radars. SAR is typically mounted on a moving platform, such as an aircraft or spacecraft, and has its origins in an advanced form of side looking airborne radar (SLAR). The distance the SAR device travels over a target during the period when the target scene is illuminated creates the large synthetic antenna aperture. Typically, the larger the aperture, the higher the image resolution will be, regardless of whether the aperture is physical or synthetic – this allows SAR to create high-resolution images with comparatively small physical antennas. For a fixed antenna size and orientation, objects which are further away remain illuminated longer – therefore SAR has the property of creating larger synthetic apertures for more distant objects, which results in a consistent spatial resolution over a range of viewing distances.
India's remote sensing program was developed with the idea of applying space technologies for the benefit of humankind and the development of the country. The program involved the development of three principal capabilities. The first was to design, build and launch satellites to a Sun-synchronous orbit. The second was to establish and operate ground stations for spacecraft control, data transfer along with data processing and archival. The third was to use the data obtained for various applications on the ground.

Multispectral imaging captures image data within specific wavelength ranges across the electromagnetic spectrum. The wavelengths may be separated by filters or detected with the use of instruments that are sensitive to particular wavelengths, including light from frequencies beyond the visible light range, i.e. infrared and ultra-violet. It can allow extraction of additional information the human eye fails to capture with its visible receptors for red, green and blue. It was originally developed for military target identification and reconnaissance. Early space-based imaging platforms incorporated multispectral imaging technology to map details of the Earth related to coastal boundaries, vegetation, and landforms. Multispectral imaging has also found use in document and painting analysis.
Leaf area index (LAI) is a dimensionless quantity that characterizes plant canopies. It is defined as the one-sided green leaf area per unit ground surface area in broadleaf canopies. In conifers, three definitions for LAI have been used:

Impervious surfaces are mainly artificial structures—such as pavements that are covered by water-resistant materials such as asphalt, concrete, brick, stone—and rooftops. Soils compacted by urban development are also highly impervious.

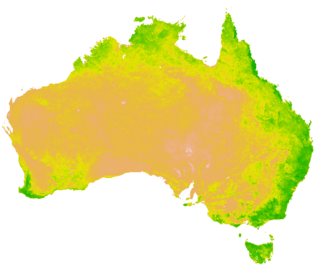
The normalized difference vegetation index (NDVI) is a widely-used metric for quantifying the health and density of vegetation using sensor data. It is calculated from spectrometric data at two specific bands: red and near-infrared. The spectrometric data is usually sourced from remote sensors, such as satellites.

Interferometric synthetic aperture radar, abbreviated InSAR, is a radar technique used in geodesy and remote sensing. This geodetic method uses two or more synthetic aperture radar (SAR) images to generate maps of surface deformation or digital elevation, using differences in the phase of the waves returning to the satellite or aircraft. The technique can potentially measure millimetre-scale changes in deformation over spans of days to years. It has applications for geophysical monitoring of natural hazards, for example earthquakes, volcanoes and landslides, and in structural engineering, in particular monitoring of subsidence and structural stability.
Multispectral remote sensing is the collection and analysis of reflected, emitted, or back-scattered energy from an object or an area of interest in multiple bands of regions of the electromagnetic spectrum. Subcategories of multispectral remote sensing include hyperspectral, in which hundreds of bands are collected and analyzed, and ultraspectral remote sensing where many hundreds of bands are used. The main purpose of multispectral imaging is the potential to classify the image using multispectral classification. This is a much faster method of image analysis than is possible by human interpretation.
In statistics, adaptive or "variable-bandwidth" kernel density estimation is a form of kernel density estimation in which the size of the kernels used in the estimate are varied depending upon either the location of the samples or the location of the test point. It is a particularly effective technique when the sample space is multi-dimensional.

In non-parametric statistics, the Theil–Sen estimator is a method for robustly fitting a line to sample points in the plane by choosing the median of the slopes of all lines through pairs of points. It has also been called Sen's slope estimator, slope selection, the single median method, the Kendall robust line-fit method, and the Kendall–Theil robust line. It is named after Henri Theil and Pranab K. Sen, who published papers on this method in 1950 and 1968 respectively, and after Maurice Kendall because of its relation to the Kendall tau rank correlation coefficient.
Normalized Difference Water Index (NDWI) may refer to one of at least two remote sensing-derived indexes related to liquid water:
A vegetation index (VI) is a spectral imaging transformation of two or more image bands designed to enhance the contribution of vegetation properties and allow reliable spatial and temporal inter-comparisons of terrestrial photosynthetic activity and canopy structural variations.

Remote sensing is used in the geological sciences as a data acquisition method complementary to field observation, because it allows mapping of geological characteristics of regions without physical contact with the areas being explored. About one-fourth of the Earth's total surface area is exposed land where information is ready to be extracted from detailed earth observation via remote sensing. Remote sensing is conducted via detection of electromagnetic radiation by sensors. The radiation can be naturally sourced, or produced by machines and reflected off of the Earth surface. The electromagnetic radiation acts as an information carrier for two main variables. First, the intensities of reflectance at different wavelengths are detected, and plotted on a spectral reflectance curve. This spectral fingerprint is governed by the physio-chemical properties of the surface of the target object and therefore helps mineral identification and hence geological mapping, for example by hyperspectral imaging. Second, the two-way travel time of radiation from and back to the sensor can calculate the distance in active remote sensing systems, for example, Interferometric synthetic-aperture radar. This helps geomorphological studies of ground motion, and thus can illuminate deformations associated with landslides, earthquakes, etc.
BAITSSS is biophysical Evapotranspiration (ET) computer model that determines water use, primarily in agriculture landscape, using remote sensing-based information. It was developed and refined by Ramesh Dhungel and the water resources group at University of Idaho's Kimberly Research and Extension Center since 2010. It has been used in different areas in the United States including Southern Idaho, Northern California, northwest Kansas, Texas, and Arizona.
Land cover maps are tools that provide vital information about the Earth's land use and cover patterns. They aid policy development, urban planning, and forest and agricultural monitoring.
Applications of machine learning in earth sciences include geological mapping, gas leakage detection and geological features identification. Machine learning (ML) is a type of artificial intelligence (AI) that enables computer systems to classify, cluster, identify and analyze vast and complex sets of data while eliminating the need for explicit instructions and programming. Earth science is the study of the origin, evolution, and future of the planet Earth. The Earth system can be subdivided into four major components including the solid earth, atmosphere, hydrosphere and biosphere.
An area sampling frame is an alternative to the most traditional type of sampling frames.