South Australian state election, 27 March 1915 Contents | ||||||
---|---|---|---|---|---|---|
Enrolled voters | 181,516 | |||||
Votes cast | 136,055 | Turnout | 74.95% | + 3.09% | ||
Informal votes | 1,441 | Informal | 1.06% | – 0.29% | ||
Summary of votes by party | ||||||
Party | Primary votes | % | Swing | Seats | Change | |
Liberal Union | 171,993 | 51.58% | + 0.17% | 20 | – 4 | |
Labor | 153,034 | 45.90% | – 0.88% | 26 | + 10 | |
Independent | 8,405 | 2.52% | + 0.71% | 0 | ± 0 | |
Total | 333,432 | 46 |
This is a list of House of Assembly results for the 1915 South Australian state election. Each district elected multiple members.
Every voter would receive a ballot paper where they would cast 2 or 3 votes for different candidates. In electorates that were not unopposed, the 2 or 3 candidates with the most votes would be elected.
Party | Candidate | Votes | % | ±% | |
---|---|---|---|---|---|
Labor | Bill Denny (elected) | unopposed | |||
Labor | John Gunn (elected) | unopposed | |||
Labor | Reginald Blundell (elected) | unopposed |
Party | Candidate | Votes | % | ±% | |
---|---|---|---|---|---|
Liberal Union | William Angus (elected) | 2,861 | 32.0 | ||
Liberal Union | R. A. O'Connor (elected) | 2,787 | 31.1 | ||
Labor | Gwynfred Oram | 2,019 | 22.6 | ||
Independent | Walter Campbell | 1,285 | 14.4 | ||
Total formal votes | 8,952 4,930 ballots | 98.9 | |||
Informal votes | 57 | 1.1 | |||
Turnout | 4,987 | 65.9 | |||
Party total votes | |||||
Liberal Union | 5,648 | 63.1 | |||
Labor | 2,019 | 22.6 | |||
Independent | Walter Campbell | 1,285 | 14.4 |
Party | Candidate | Votes | % | ±% | |
---|---|---|---|---|---|
Liberal Union | George Ritchie (elected) | 5,250 | 19.9 | ||
Liberal Union | George Laffer (elected) | 5,172 | 19.6 | ||
Liberal Union | Alexander McDonald (elected) | 5,076 | 19.3 | ||
Labor | Thomas Grealy | 3,693 | 14.0 | ||
Labor | Bryan Blundell | 3,591 | 13.6 | ||
Labor | Stanley Herring | 3,570 | 13.6 | ||
Total formal votes | 26,352 8,929 ballots | 98.9 | |||
Informal votes | 98 | 1.1 | |||
Turnout | 9,027 | 75.2 | |||
Party total votes | |||||
Liberal Union | 15,498 | 58.8 | |||
Labor | 10,854 | 41.2 |
Party | Candidate | Votes | % | ±% | |
---|---|---|---|---|---|
Liberal Union | Richard Butler (elected) | 5,082 | 18.3 | ||
Liberal Union | William Hague (elected) | 5,001 | 18.0 | ||
Labor | Ephraim Coombe (elected) | 4,856 | 17.5 | ||
Liberal Union | Samuel Rudall | 4,802 | 17.3 | ||
Labor | Norman Makin | 4,182 | 15.0 | ||
Labor | Max Riedel | 3,900 | 14.0 | ||
Total formal votes | 27,823 9,491 ballots | 99.5 | |||
Informal votes | 47 | 0.5 | |||
Turnout | 9,538 | 81.0 | |||
Party total votes | |||||
Liberal Union | 14,885 | 53.5 | |||
Labor | 12,938 | 46.5 |
Party | Candidate | Votes | % | ±% | |
---|---|---|---|---|---|
Liberal Union | John Pick (elected) | 5,882 | 19.5 | ||
Liberal Union | William Miller (elected) | 5,842 | 19.4 | ||
Liberal Union | Laurence O'Loughlin (elected) | 5,770 | 19.1 | ||
Labor | Edward Pearce | 4,387 | 14.5 | ||
Labor | Arrol Penglase | 4,195 | 13.9 | ||
Labor | Even George | 4,105 | 13.6 | ||
Total formal votes | 30,181 10,170 ballots | 99.1 | |||
Informal votes | 95 | 0.9 | |||
Turnout | 10,265 | 76.8 | |||
Party total votes | |||||
Liberal Union | 17,494 | 58.0 | |||
Labor | 12,687 | 42.0 |
Party | Candidate | Votes | % | ±% | |
---|---|---|---|---|---|
Labor | Frederick Coneybeer (elected) | 11,672 | 23.6 | ||
Labor | Lionel Hill (elected) | 10,466 | 21.2 | ||
Labor | John Southwood (elected) | 10,367 | 21.0 | ||
Liberal Union | Nathaniel Hargrave | 7,262 | 14.7 | ||
Liberal Union | William Dring | 7,117 | 14.4 | ||
Independent | Peter Addison | 2,528 | 5.1 | ||
Total formal votes | 49,412 18,210 ballots | 97.9 | |||
Informal votes | 382 | 2.1 | |||
Turnout | 18,592 | 71.6 | |||
Party total votes | |||||
Labor | 32,505 | 65.8 | |||
Liberal Union | 14,379 | 29.1 | |||
Independent | Peter Addison | 2,528 | 5.1 |
Party | Candidate | Votes | % | ±% | |
---|---|---|---|---|---|
Liberal Union | James Moseley (elected) | 3,387 | 33.3 | ||
Liberal Union | John Travers (elected) | 3,329 | 32.7 | ||
Labor | John Cronin | 1,757 | 17.3 | ||
Labor | Frank Davies | 1,697 | 16.7 | ||
Total formal votes | 10,170 5,135 ballots | 99.0 | |||
Informal votes | 53 | 1.0 | |||
Turnout | 5,188 | 70.8 | |||
Party total votes | |||||
Liberal Union | 6,716 | 66.0 | |||
Labor | 3,454 | 34.0 |
Party | Candidate | Votes | % | ±% | |
---|---|---|---|---|---|
Liberal Union | Harry Young (elected) | 4,511 | 19.3 | ||
Labor | Maurice Parish (elected) | 4,271 | 18.2 | ||
Labor | George Dunn (elected) | 4,051 | 17.3 | ||
Liberal Union | Hermann Homburg | 3,979 | 17.0 | ||
Liberal Union | Friedrich Pflaum | 3,659 | 15.6 | ||
Independent | David Wellington | 1,958 | 8.4 | ||
Independent | Archibald Duncan | 1,004 | 4.3 | ||
Total formal votes | 23,433 9,019 ballots | 99.3 | |||
Informal votes | 66 | 0.7 | |||
Turnout | 9,085 | 78.3 | |||
Party total votes | |||||
Liberal Union | 12,149 | 51.8 | |||
Labor | 8,322 | 35.5 | |||
Independent | David Wellington | 1,958 | 8.4 | ||
Independent | Archibald Duncan | 1,004 | 4.3 |
Party | Candidate | Votes | % | ±% | |
---|---|---|---|---|---|
Labor | Thomas Butterfield (elected) | 2,417 | 28.4 | ||
Labor | Andrew Kirkpatrick (elected) | 2,399 | 28.2 | ||
Liberal Union | Thomas Burgoyne | 1,870 | 22.0 | ||
Liberal Union | Edward Twopeny | 1,832 | 21.5 | ||
Total formal votes | 8,518 4,776 ballots | 98.4 | |||
Informal votes | 71 | 1.6 | |||
Turnout | 4,847 | 72.7 | |||
Party total votes | |||||
Labor | 4,816 | 56.5 | |||
Liberal Union | 3,702 | 46.5 |
Party | Candidate | Votes | % | ±% | |
---|---|---|---|---|---|
Labor | Edward Anstey (elected) | 6,186 | 28.7 | ||
Labor | William Ponder (elected) | 5,997 | 27.8 | ||
Liberal Union | Lewis Cohen | 4,766 | 22.1 | ||
Liberal Union | Thomas Crase | 4,638 | 21.5 | ||
Total formal votes | 21,587 10,930 ballots | 98.9 | |||
Informal votes | 121 | 1.1 | |||
Turnout | 11,051 | 73.0 | |||
Party total votes | |||||
Labor | 12,183 | 56.4 | |||
Liberal Union | 9,404 | 43.6 |
Party | Candidate | Votes | % | ±% | |
---|---|---|---|---|---|
Labor | Ivor MacGillivray (elected) | unopposed | |||
Labor | John Price (elected) | unopposed |
Party | Candidate | Votes | % | ±% | |
---|---|---|---|---|---|
Labor | William Cole (elected) | unopposed | |||
Labor | Harry Jackson (elected) | unopposed |
Party | Candidate | Votes | % | ±% | |
---|---|---|---|---|---|
Liberal Union | Robert Nicholls (elected) | 4,530 | 38.4 | ||
Liberal Union | Henry Barwell (elected) | 4,426 | 37.6 | ||
Labor | John Fitzgerald | 2,828 | 24.0 | ||
Total formal votes | 11,784 7,126 ballots | 99.4 | |||
Informal votes | 46 | 0.6 | |||
Turnout | 7,172 | 79.4 | |||
Party total votes | |||||
Liberal Union | 8,956 | 76.0 | |||
Labor | 2,828 | 24.0 |
Party | Candidate | Votes | % | ±% | |
---|---|---|---|---|---|
Labor | Crawford Vaughan (elected) | 11,534 | 18.5 | ||
Labor | Thomas Smeaton (elected) | 11,502 | 18.5 | ||
Labor | Thomas Ryan (elected) | 11,364 | 18.2 | ||
Liberal Union | Angas Parsons | 9,869 | 15.8 | ||
Liberal Union | Herbert Hudd | 9,183 | 14.7 | ||
Liberal Union | Noel Webb | 8,842 | 14.2 | ||
Total formal votes | 62,294 21,119 ballots | 98.9 | |||
Informal votes | 238 | 1.1 | |||
Turnout | 21,357 | 73.3 | |||
Party total votes | |||||
Labor | 34,400 | 55.2 | |||
Liberal Union | 27,894 | 44.8 |
Party | Candidate | Votes | % | ±% | |
---|---|---|---|---|---|
Labor | Peter Reidy (elected) | 5,650 | 26.3 | ||
Labor | Clarence Goode (elected) | 5,585 | 26.0 | ||
Liberal Union | George Bodey | 5,142 | 23.9 | ||
Liberal Union | Archibald Peake | 5,116 | 23.8 | ||
Total formal votes | 21,493 10,806 ballots | 99.3 | |||
Informal votes | 73 | 0.7 | |||
Turnout | 10,879 | 80.8 | |||
Party total votes | |||||
Labor | 11,235 | 52.3 | |||
Liberal Union | 10,258 | 47.7 |
Party | Candidate | Votes | % | ±% | |
---|---|---|---|---|---|
Labor | John Verran (elected) | unopposed | |||
Labor | John Herbert (elected) | unopposed |
Party | Candidate | Votes | % | ±% | |
---|---|---|---|---|---|
Labor | Henry Chesson (elected) | unopposed | |||
Labor | Thompson Green (elected) | unopposed |
Party | Candidate | Votes | % | ±% | |
---|---|---|---|---|---|
Liberal Union | Richard Butler (elected) | 5,717 | 26.4 | ||
Liberal Union | David James (elected) | 5,585 | 25.8 | ||
Liberal Union | Albert Robinson (elected) | 5,467 | 25.3 | ||
Labor | Frederick Birrell | 3,254 | 15.0 | ||
Independent | Herbert Tuck | 1,630 | 7.5 | ||
Total formal votes | 21,653 8,857 ballots | 99.6 | |||
Informal votes | 39 | 0.4 | |||
Turnout | 8,896 | 79.6 | |||
Party total votes | |||||
Liberal Union | 16,769 | 77.4 | |||
Labor | 3,254 | 15.0 | |||
Independent | Herbert Tuck | 1,630 | 7.5 |
Party | Candidate | Votes | % | ±% | |
---|---|---|---|---|---|
Liberal Union | Henry Tossell (elected) | 4,124 | 42.2 | ||
Liberal Union | Peter Allen (elected) | 4,117 | 42.1 | ||
Labor | Robert Kinnane | 1,539 | 15.7 | ||
Total formal votes | 9,780 5,585 ballots | 99.0 | |||
Informal votes | 55 | 1.0 | |||
Turnout | 5,640 | 77.6 | |||
Party total votes | |||||
Liberal Union | 8,241 | 84.3 | |||
Labor | 1,539 | 15.7 |
The electoral system of Australia comprises the laws and processes used for the election of members of the Australian Parliament and is governed primarily by the Commonwealth Electoral Act 1918. The system presently has a number of distinctive features including compulsory enrolment; compulsory voting; majority-preferential instant-runoff voting in single-member seats to elect the lower house, the House of Representatives; and the use of the single transferable vote proportional representation system to elect the upper house, the Senate.
Electoral systems of the Australian states and territories are broadly similar to the electoral system used in federal elections in Australia.
The Legislative Council, or upper house, is one of the two chambers of the Parliament of South Australia. Its central purpose is to act as a house of review for legislation passed through the lower house, the House of Assembly. It sits in Parliament House in the state capital, Adelaide.
The South Australian House of Assembly is one of the two chambers of the Parliament of South Australia, the other being the Legislative Council. It sits in Parliament House in the state capital, Adelaide.
The Parliament of South Australia is the bicameral legislature of the Australian state of South Australia. It consists of the 47-seat House of Assembly and the 22-seat Legislative Council. General elections are held every 4 years, with all of the lower house and half of the upper house filled at each election. It follows a Westminster system of parliamentary government with the executive branch required to both sit in parliament and hold the confidence of the House of Assembly. The parliament is based at Parliament House on North Terrace in the state capital of Adelaide.
Australian Greens SA is a green political party located in the Australian state of South Australia. It is a member of the federation of the Australian Greens party.
The 1912–13 United States Senate elections were held on various dates in various states. They were the last U.S. Senate elections before the ratification of the Seventeenth Amendment in 1913, establishing direct elections for all Senate seats. Senators had been primarily chosen by state legislatures. Senators were elected over a wide range of time throughout 1912 and 1913, and a seat may have been filled months late or remained vacant due to legislative deadlock. Some states elected their senators directly even before passage of Seventeenth Amendment. Oregon pioneered direct election and experimented with different measures over several years until it succeeded in 1907. Soon after, Nebraska followed suit and laid the foundation for other states to adopt measures reflecting the people's will. By 1912, as many as 29 states elected senators either as nominees of their party's primary or in conjunction with a general election.
State elections were held in South Australia on 17 September 1977. All 47 seats in the South Australian House of Assembly were up for election. The incumbent Australian Labor Party led by Premier of South Australia Don Dunstan won a fourth term in government, defeating the Liberal Party of Australia led by Leader of the Opposition David Tonkin.
The 1978 New South Wales state election was held on 7 October 1978 to elect all 99 members of the New South Wales Legislative Assembly. The Labor Party defeated the incumbent Liberal/National coalition government in a landslide victory under leader Neville Wran, with the election popularly known as the "Wranslide".
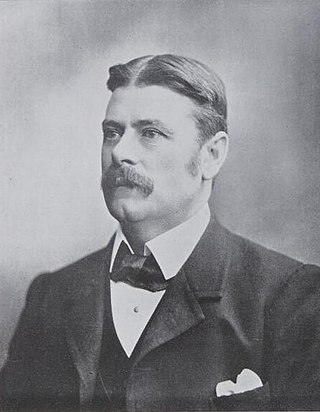
The 1902 South Australian state election was held on 3 May 1902 following the dissolution of both houses. All 42 seats in the South Australian House of Assembly were up for election, and all 18 seats in the Legislative Council. The House had a reduction of 12 seats compared to the previous election. The Council was reduced from 6 members in each of four districts to 6 members from Central District and four from each of North-Eastern, Northern and Southern Districts. The incumbent liberal government led by Premier of South Australia John Jenkins in an informal coalition with the conservatives defeated the United Labor Party (ULP) led by Thomas Price. Each of the 13 districts elected multiple members, with voters casting multiple votes.
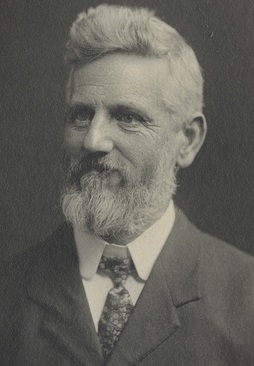
The 1905 South Australian state election was held on 27 May 1905. All 42 seats in the South Australian House of Assembly were up for election. The incumbent conservative government led by Premier of South Australia Richard Butler in an informal coalition with the liberals was defeated by the United Labor Party (ULP) led by Leader of the Opposition Thomas Price. Each of the 13 districts elected multiple members, with voters casting multiple votes.
State elections were held in South Australia on 2 April 1910. All 42 seats in the South Australian House of Assembly were up for election. The incumbent Liberal and Democratic Union (LDU) government led by Premier of South Australia Archibald Peake was defeated by the United Labor Party (ULP) led by John Verran. Each of the 13 districts elected multiple members, with voters casting multiple votes. The Peake LDU minority government had replaced the Price ULP/LDU coalition government in June 1909. The 1910 election was the first to result in a South Australian majority government. This came two weeks after the election of a first majority in either house in the Parliament of Australia at the 1910 federal election, also for Labor. Though a South Australian majority was won, the ULP did not take office until after the new lower house first met.
State elections were held in South Australia on 27 March 1915. All 46 seats in the South Australian House of Assembly were up for election. The incumbent Liberal Union government led by Premier of South Australia Archibald Peake was defeated by the opposition United Labor Party led by Leader of the Opposition Crawford Vaughan. Each district elected multiple members, with voters casting multiple votes.
Elections were held in the Australian state of Queensland on 11 May 1929 to elect the 72 members of the state's Legislative Assembly. In this election, Irene Longman became the first woman to both stand and be elected into the Queensland Parliament.
Members of the New South Wales Legislative Assembly who served in the 23rd parliament of New South Wales held their seats from 1913 to 1917. They were elected at the 1913 state election on 6 December 1913. The Speaker was Richard Meagher.
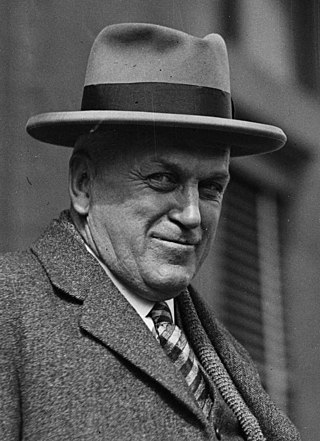
Murray is a defunct electoral district that elected members to the House of Assembly, the lower house of the bicameral legislature of the Australian state of South Australia. The electorate, incorporating part of the River Murray, was rural in nature, with Mannum the only large town within its boundaries. From its establishment to the 1938 state election, Murray was a three-member electorate, but was made a single-member electorate afterwards, as part of a system of electoral malapportionment known as the "Playmander". In both incarnations it elected candidates from both major parties as marginal and safe seat holders at various times. If just 21 LCL votes were Labor votes in Murray at the 1968 election, Labor would have formed majority government. Murray was one of two gains in 1968 that put the LCL in office. The electorate was abolished prior to the 1985 election, with its territory now forming part of the districts of Hammond, Kavel, and Schubert. In total, 24 people represented Murray between 1902 and 1985, with its most notable member being Thomas Playford IV, who later served as Premier of South Australia.
The 2021 Western Australian state election was held on Saturday 13 March to elect members to the Parliament of Western Australia, where all 59 seats in the Legislative Assembly and all 36 seats in the Legislative Council were up for election.
SA-Best, formerly known as Nick Xenophon's SA-BEST, is a political party in South Australia. It was founded in 2017 by Nick Xenophon as a state-based partner to his Nick Xenophon Team party. After an unsuccessful 2022 South Australian state election, the party has one representative in the South Australian Legislative Council, Connie Bonaros, whose term expires in 2026.
This is a list of House of Assembly results for the 1924 South Australian state election. Each district elected multiple members.
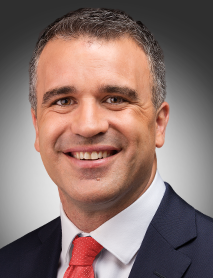
The 2022 South Australian state election was held on 19 March 2022 to elect members to the 55th Parliament of South Australia. All 47 seats in the House of Assembly, and half the seats in the Legislative Council were up for re-election.