South Australian state election, 9 April 1921 [1] Contents | ||||||
---|---|---|---|---|---|---|
Enrolled voters | 289,843 | |||||
Votes cast | 161,165 | Turnout | 62.71% | -1.06% | ||
Informal votes | 1,774 | Informal | N/A | |||
Summary of votes by party | ||||||
Party | Primary votes | % | Swing | Seats | Change | |
Labor | 179,308 | 44.62% | -0.07% | 16 | - 1 | |
Liberal Union | 140,229 | 34.90% | +6.96% | 25 | + 3 | |
Progressive Country | 51,603 | 12.84% | -5.82% | 1 | - 5 | |
Farmers and Settlers | 16,417 | 4.09% | -0.18% | 4 | + 3 | |
Independent | 14,288 | 3.56% | -0.28% | 0 | ± 0 | |
Total | 401,845 | 46 |
This is a list of House of Assembly results for the 1921 South Australian state election. Each district elected multiple members.
Every voter would receive a ballot paper where they would cast 2 or 3 votes for different candidates. In electorates that were not unopposed, the 2 or 3 candidates with the most votes would be elected.
Party | Candidate | Votes | % | ±% | |
---|---|---|---|---|---|
Labor | John Gunn (elected) | 7,150 | 31.1 | +6.4 | |
Labor | Bill Denny (elected) | 7,021 | 30.5 | -0.3 | |
Labor | Bert Edwards (elected) | 6,503 | 28.2 | +3.6 | |
Progressive Country | James Mitchell | 2,352 | 10.2 | +10.2 | |
Total formal votes | 23,026 8,838 ballots | 98.1 | −0.7 | ||
Informal votes | 171 | 1.9 | +0.7 | ||
Turnout | 9,009 | 51.3 | +15.2 | ||
Party total votes | |||||
Labor | 20,674 | 89.8 | +10.3 | ||
Progressive Country | 2,352 | 10.2 | –8.3 |
Party | Candidate | Votes | % | ±% | |
---|---|---|---|---|---|
Farmers and Settlers | Malcolm McIntosh (elected) | 2,111 | 18.7 | +18.7 | |
Farmers and Settlers | Frederick McMillan (elected) | 2,105 | 18.6 | +18.6 | |
Liberal Union | Richard O'Connor | 2,103 | 18.6 | -0.6 | |
Liberal Union | William Angus | 1,995 | 17.6 | +0.2 | |
Labor | Joshua Pedlar | 1,514 | 13.4 | +13.4 | |
Labor | Thomas Knuckey | 1,479 | 13.1 | +13.1 | |
Total formal votes | 11,307 5,696 ballots | 98.1 | +0.1 | ||
Informal votes | 109 | 1.9 | −0.1 | ||
Turnout | 5,805 | 56.3 | +2.3 | ||
Party total votes | |||||
Farmers and Settlers | 4,216 | 37.3 | +3.2 | ||
Liberal Union | 4,098 | 36.2 | -0.4 | ||
Labor | 2,993 | 26.5 | -2.7 |
Party | Candidate | Votes | % | ±% | |
---|---|---|---|---|---|
Liberal Union | George Ritchie (elected) | 4,344 | 27.7 | +5.9 | |
Liberal Union | George Laffer (elected) | 4,291 | 27.4 | +5.4 | |
Liberal Union | Herbert Hudd (elected) | 4,197 | 26.8 | +26.8 | |
Labor | Matthew Hunt | 1,657 | 10.6 | -0.6 | |
Progressive Country | Walter Furler | 1,192 | 7.6 | +3.8 | |
Total formal votes | 15,681 6,214 ballots | 98.8 | +0.4 | ||
Informal votes | 77 | 1.2 | −0.4 | ||
Turnout | 6,291 | 51.9 | −0.7 | ||
Party total votes | |||||
Liberal Union | 12,832 | 81.8 | +17.9 | ||
Labor | 1,657 | 10.6 | -21.7 | ||
Progressive Country | 1,192 | 7.6 | +7.6 |
Party | Candidate | Votes | % | ±% | |
---|---|---|---|---|---|
Liberal Union | William Hague (elected) | 4,766 | 18.7 | +2.4 | |
Liberal Union | Henry Crosby (elected) | 4,649 | 18.3 | +2.3 | |
Liberal Union | Richard Butler (elected) | 4,264 | 16.8 | +0.9 | |
Labor | George Cooke | 3,817 | 15.0 | -0.3 | |
Labor | Leonard Hopkins | 3,549 | 13.9 | +13.9 | |
Labor | Edwin Parham | 3,317 | 13.0 | +13.0 | |
Progressive Country | Albert Nairne | 1,091 | 4.3 | +4.3 | |
Total formal votes | 25,453 8,665 ballots | 99.0 | +0.4 | ||
Informal votes | 86 | 1.0 | −0.4 | ||
Turnout | 8,751 | 74.4 | +10.9 | ||
Party total votes | |||||
Liberal Union | 13,679 | 53.7 | +5.5 | ||
Labor | 10,683 | 42.0 | -4.6 | ||
Progressive Country | 1,091 | 4.3 | +4.3 |
Party | Candidate | Votes | % | ±% | |
---|---|---|---|---|---|
Farmers and Settlers | Thomas Hawke (elected) | 4,315 | 16.6 | +16.6 | |
Liberal Union | George Jenkins (elected) | 4,214 | 16.2 | +4.2 | |
Liberal Union | Samuel Dickson (elected) | 3,986 | 15.3 | +3.5 | |
Labor | Mick O'Halloran | 3,864 | 14.9 | +2.8 | |
Labor | Harry Buxton | 3,739 | 14.4 | +2.2 | |
Labor | Leonard Wilcott | 3,611 | 13.9 | +1.9 | |
Progressive Country | James McDonald | 1,480 | 5.7 | +5.7 | |
Independent | Edward Craigie | 816 | 3.1 | +3.1 | |
Total formal votes | 26,025 8,939 ballots | 98.6 | −0.6 | ||
Informal votes | 123 | 1.4 | +0.6 | ||
Turnout | 9,062 | 68.9 | +6.8 | ||
Party total votes | |||||
Labor | 11,214 | 43.1 | +6.8 | ||
Liberal Union | 8,200 | 31.5 | +7.7 | ||
Farmers and Settlers | 4,315 | 16.6 | -11.5 | ||
Progressive Country | 1,480 | 5.7 | -6.0 | ||
Independent | Edward Craigie | 816 | 3.1 | +3.1 |
Party | Candidate | Votes | % | ±% | |
---|---|---|---|---|---|
Liberal Union | Walter Hamilton (elected) | 7,827 | 14.1 | -2.7 | |
Liberal Union | Joseph Harper (elected) | 7,386 | 13.3 | +13.3 | |
Labor | Leslie Hunkin (elected) | 7,115 | 12.8 | +12.8 | |
Liberal Union | Albert Sutton | 6,988 | 12.6 | +12.6 | |
Labor | Herbert George | 6,715 | 12.1 | -1.6 | |
Labor | James Flaherty | 6,491 | 11.7 | +11.7 | |
Progressive Country | Frederick Coneybeer | 5,548 | 10.0 | -8.7 | |
Progressive Country | Alexander Jolly | 3,805 | 6.9 | +6.9 | |
Progressive Country | Thomas Buttery | 3,683 | 6.6 | +6.6 | |
Total formal votes | 55,558 18,745 ballots | 98.9 | +0.4 | ||
Informal votes | 207 | 1.1 | −0.4 | ||
Turnout | 18,952 | 63.2 | +16.8 | ||
Party total votes | |||||
Liberal Union | 22,201 | 40.0 | +23.2 | ||
Labor | 20,321 | 36.6 | -4.7 | ||
Progressive Country | 13,036 | 23.5 | -11.4 |
Party | Candidate | Votes | % | ±% | |
---|---|---|---|---|---|
Liberal Union | James Moseley (elected) | 2,582 | 26.2 | -7.1 | |
Farmers and Settlers | John Chapman (elected) | 2,427 | 24.6 | -1.5 | |
Independent | Samuel Lindsay | 1,332 | 13.5 | -8.2 | |
Labor | Michael Murphy | 1,218 | 12.4 | +12.4 | |
Labor | Thomas Lyons | 1,159 | 11.8 | +12.4 | |
Independent | Harr Frick | 1,130 | 11.5 | +11.5 | |
Total formal votes | 9,848 4,973 ballots | 98.4 | +0.1 | ||
Informal votes | 83 | 1.6 | −0.1 | ||
Turnout | 5,056 | 61.4 | +10.9 | ||
Party total votes | |||||
Liberal Union | 2,582 | 26.2 | -26.0 | ||
Farmers and Settlers | 2,427 | 24.6 | -1.5 | ||
Labor | 2,377 | 24.1 | +24.1 | ||
Independent | Samuel Lindsay | 1,332 | 13.5 | -8.2 | |
Independent | Harr Frick | 1,130 | 11.5 | +11.5 |
Party | Candidate | Votes | % | ±% | |
---|---|---|---|---|---|
Liberal Union | Harry Young (elected) | 4,100 | 19.1 | +0.6 | |
Liberal Union | John Godfree (elected) | 3,749 | 17.5 | +17.5 | |
Liberal Union | John Randell (elected) | 3,647 | 17.0 | +17.0 | |
Labor | Frank Staniford | 2,948 | 13.8 | +0.3 | |
Labor | Sid O'Flaherty | 2,881 | 13.4 | -1.5 | |
Labor | Bert Hoare | 2,807 | 13.1 | +13.1 | |
Farmers and Settlers | James Daniel | 1,295 | 6.0 | +6.0 | |
Total formal votes | 21,427 7,394 ballots | 99.2 | +0.2 | ||
Informal votes | 56 | 0.8 | −0.2 | ||
Turnout | 7,450 | 61.3 | +4.4 | ||
Party total votes | |||||
Liberal Union | 11,496 | 53.7 | +21.3 | ||
Labor | 8,636 | 40.3 | -1.2 | ||
Farmers and Settlers | 1,295 | 6.0 | +6.0 |
Party | Candidate | Votes | % | ±% | |
---|---|---|---|---|---|
Labor | Thomas Butterfield (elected) | 2,396 | 30.4 | -0.5 | |
Labor | William Harvey (elected) | 2,241 | 28.1 | +0.3 | |
Liberal Union | Edward Twopeny | 1,699 | 21.5 | -0.7 | |
Farmers and Settlers | John Smith | 1,554 | 19.7 | +19.7 | |
Total formal votes | 7,890 4,003 ballots | 98.9 | −0.2 | ||
Informal votes | 46 | 1.1 | +0.2 | ||
Turnout | 4,049 | 59.6 | +5.9 | ||
Party total votes | |||||
Labor | 4,637 | 58.8 | -0.2 | ||
Liberal Union | 1,699 | 21.5 | -19.5 | ||
Farmers and Settlers | 1,554 | 19.7 | +19.7 |
Party | Candidate | Votes | % | ±% | |
---|---|---|---|---|---|
Labor | Frederick Birrell (elected) | 4,486 | 23.1 | +23.1 | |
Labor | Stanley Whitford (elected) | 4,288 | 22.1 | +22.1 | |
Liberal Union | Charles Butler | 4,195 | 21.6 | +21.6 | |
Progressive Country | Edward Anstey | 3,898 | 20.1 | -10.1 | |
Progressive Country | William Ponder | 2,522 | 13.0 | -16.4 | |
Total formal votes | 19,389 10,945 ballots | 98.6 | +0.1 | ||
Informal votes | 151 | 1.4 | −0.1 | ||
Turnout | 11,096 | 65.4 | +18.6 | ||
Party total votes | |||||
Labor | 8,774 | 45.3 | +4.9 | ||
Progressive Country | 6,420 | 33.1 | -26.5 | ||
Liberal Union | 4,195 | 21.6 | +21.6 |
Party | Candidate | Votes | % | ±% | |
---|---|---|---|---|---|
Labor | John Price (elected) | 9,319 | 35.5 | +2.8 | |
Labor | John Verran (elected) | 8,769 | 33.4 | +2.3 | |
Farmers and Settlers | Joseph Lambert | 4,281 | 16.3 | +16.3 | |
Liberal Union | Leon Colley | 3,860 | 14.7 | +14.7 | |
Total formal votes | 26,229 13,219 ballots | 99.1 | +2.1 | ||
Informal votes | 122 | 0.9 | −2.1 | ||
Turnout | 13,341 | 61.1 | +13.1 | ||
Party total votes | |||||
Labor | 18,088 | 69.0 | +5.2 | ||
Farmers and Settlers | 4,281 | 16.3 | +16.3 | ||
Liberal Union | 3,860 | 14.7 | +14.7 |
Party | Candidate | Votes | % | ±% | |
---|---|---|---|---|---|
Labor | Lionel Hill (elected) | 3,190 | 40.8 | +7.8 | |
Labor | John Fitzgerald (elected) | 3,074 | 39.4 | +7.0 | |
Independent | William Blight | 1,548 | 19.8 | +19.8 | |
Total formal votes | 7,812 4,569 ballots | 99.2 | 0.0 | ||
Informal votes | 37 | 0.8 | 0.0 | ||
Turnout | 4,606 | 72.7 | +14.2 | ||
Party total votes | |||||
Labor | 6,264 | 80.2 | +14.8 | ||
Independent | 1,548 | 19.8 | +19.8 |
Party | Candidate | Votes | % | ±% | |
---|---|---|---|---|---|
Liberal Union | Robert Nicholls (elected) | 4,050 | 31.5 | -2.9 | |
Liberal Union | Henry Barwell (elected) | 3,974 | 30.9 | -2.8 | |
Labor | Even George | 1,828 | 14.2 | +14.2 | |
Labor | Albert Smith | 1,474 | 11.5 | +11.5 | |
Farmers and Settlers | Henry Sargent | 800 | 6.2 | +6.2 | |
Farmers and Settlers | John Aughey | 719 | 5.6 | +5.6 | |
Total formal votes | 12,845 6,563 ballots | 97.6 | −1.3 | ||
Informal votes | 163 | 2.4 | +1.3 | ||
Turnout | 6,726 | 73.0 | +10.0 | ||
Party total votes | |||||
Liberal Union | 8,024 | 62.5 | -5.6 | ||
Labor | 3,302 | 25.7 | +8.2 | ||
Farmers and Settlers | 1,519 | 11.8 | -2.6 |
Party | Candidate | Votes | % | ±% | |
---|---|---|---|---|---|
Liberal Union | Herbert Richards (elected) | 8,803 | 14.2 | +14.2 | |
Liberal Union | George Hussey (elected) | 8,396 | 13.5 | +13.5 | |
Liberal Union | Ernest Anthoney (elected) | 8,366 | 13.5 | +13.5 | |
Labor | Harry Kneebone | 6,849 | 11.0 | +11.0 | |
Labor | Thomas Grealy | 6,474 | 10.4 | +10.4 | |
Labor | Tom Howard | 6,282 | 10.1 | -1.5 | |
Progressive Country | Thomas Smeaton | 4,865 | 7.8 | -10.2 | |
Independent | Verge Blunden | 4,672 | 7.5 | +7.5 | |
Progressive Country | John Vaughan | 4,494 | 7.2 | +2.0 | |
Progressive Country | Alfred Morris | 2,918 | 4.7 | +4.7 | |
Total formal votes | 62,119 21,595 ballots | 99.0 | +0.4 | ||
Informal votes | 212 | 1.0 | −0.4 | ||
Turnout | 21,807 | 64.2 | +20.2 | ||
Party total votes | |||||
Liberal Union | 25,565 | 41.2 | +5.0 | ||
Labor | 19,605 | 31.6 | -3.8 | ||
Progressive Country | 12,277 | 19.8 | -3.4 | ||
Independent | Verge Blunden | 4,672 | 7.5 | +7.5 |
Party | Candidate | Votes | % | ±% | |
---|---|---|---|---|---|
Progressive Country | Peter Reidy (elected) | 4,677 | 27.5 | +2.9 | |
Liberal Union | Vernon Petherick (elected) | 4,527 | 26.6 | +1.6 | |
Labor | Eric Shepherd | 4,078 | 24.0 | +24.0 | |
Labor | Charles McHugh | 3,718 | 21.9 | +0.2 | |
Total formal votes | 17,000 8,625 ballots | 99.3 | +0.9 | ||
Informal votes | 64 | 0.7 | −0.9 | ||
Turnout | 8,689 | 69.8 | +5.3 | ||
Party total votes | |||||
Labor | 7,796 | 45.9 | +2.6 | ||
Progressive Country | 4,677 | 27.5 | +2.9 | ||
Liberal Union | 4,527 | 26.6 | +1.6 |
Party | Candidate | Votes | % | ±% | |
---|---|---|---|---|---|
Labor | Robert Richards (elected) | 3,465 | 35.2 | +1.9 | |
Labor | John Pedler (elected) | 3,359 | 34.1 | +1.2 | |
Independent | John Verran | 3,020 | 30.7 | +13.0 | |
Total formal votes | 9,844 6,343 ballots | 99.5 | +0.2 | ||
Informal votes | 32 | 0.5 | −0.2 | ||
Turnout | 6,275 | 80.1 | +4.3 | ||
Party total votes | |||||
Labor | 6,824 | 69.3 | +3.1 | ||
Independent | John Verran | 3,020 | 30.7 | +30.7 |
Party | Candidate | Votes | % | ±% | |
---|---|---|---|---|---|
Labor | Alfred Blackwell (elected) | 8,437 | 30.8 | -1.4 | |
Labor | John McInnes (elected) | 7,868 | 28.7 | -1.9 | |
Progressive Country | Henry Chesson | 5,888 | 21.5 | +2.9 | |
Liberal Union | William Dring | 5,236 | 19.1 | +19.1 | |
Total formal votes | 27,429 13,921 ballots | 98.5 | +0.5 | ||
Informal votes | 209 | 1.5 | −0.5 | ||
Turnout | 14,130 | 60.6 | +12.3 | ||
Party total votes | |||||
Labor | 16,305 | 59.4 | -3.4 | ||
Progressive Country | 5,888 | 21.5 | -15.7 | ||
Liberal Union | 5,236 | 19.1 | +19.1 |
Party | Candidate | Votes | % | ±% | |
---|---|---|---|---|---|
Liberal Union | James McLachlan (elected) | 4,303 | 18.7 | +0.9 | |
Liberal Union | Richard Butler (elected) | 4,137 | 18.0 | +3.9 | |
Liberal Union | Albert Robinson (elected) | 3,595 | 15.7 | +0.9 | |
Labor | Allan Robertson | 3,303 | 14.4 | -1.2 | |
Labor | Arthur McArthur | 2,971 | 12.9 | +12.9 | |
Labor | Alfred Tonkin | 2,884 | 12.6 | +12.6 | |
Independent | David James | 929 | 4.0 | +4.0 | |
Independent | Ruphert Bowey | 841 | 3.7 | +3.7 | |
Total formal votes | 22,963 7,890 ballots | 99.2 | +0.1 | ||
Informal votes | 66 | 0.8 | −0.1 | ||
Turnout | 7,956 | 71.7 | +6.5 | ||
Party total votes | |||||
Liberal Union | 12,035 | 52.4 | +5.7 | ||
Labor | 9,158 | 39.9 | -3.6 | ||
Independent | David James | 929 | 4.0 | +4.0 | |
Independent | Ruphert Bowey | 841 | 3.7 | +3.7 |
Party | Candidate | Votes | % | ±% | |
---|---|---|---|---|---|
Liberal Union | Peter Allen (elected) | unopposed | |||
Liberal Union | Henry Tossell (elected) | unopposed |
Electoral systems of the Australian states and territories are broadly similar to the electoral system used in federal elections in Australia.
The Legislative Council, or upper house, is one of the two chambers of the Parliament of South Australia. Its central purpose is to act as a house of review for legislation passed through the lower house, the House of Assembly. It sits in Parliament House in the state capital, Adelaide.
The House of Assembly, or lower house; Is one of the two chambers of the Parliament of South Australia. The other is the Legislative Council. It sits in Parliament House in the state capital, Adelaide.
The Parliament of South Australia is the bicameral legislature of the Australian state of South Australia. It consists of the 47-seat House of Assembly and the 22-seat Legislative Council. General elections are held every 4 years, with all of the lower house and half of the upper house filled at each election. It follows a Westminster system of parliamentary government with the executive branch required to both sit in parliament and hold the confidence of the House of Assembly. The parliament is based at Parliament House on North Terrace in the state capital of Adelaide.
Australian Greens SA is a green political party located in the Australian state of South Australia. It is a member of the federation of the Australian Greens party.
Government in Australia is elected by universal suffrage and Australian women participate in all levels of the government of the nation. In 1902, the newly formed Commonwealth of Australia became the first nation on earth to enact equal suffrage, enabling women to both vote and stand for election alongside men Women have been represented in Australian state parliaments since 1921, and in the Federal Parliament since 1943. The first female leader of an Australian State or Territory was elected in 1989, and the first female Prime Minister took office in 2010. In 2019 for the first time, a majority of members of the Australian Senate were women. At the time of its foundation in 1901, and again from 1952 to 2022, Australia has had a female monarch as ceremonial Head of State, while the first female Governor of an Australian State was appointed in 1991, and the first female Governor-General of Australia took office in 2008.
State elections were held in South Australia on 17 September 1977. All 47 seats in the South Australian House of Assembly were up for election. The incumbent Australian Labor Party led by Premier of South Australia Don Dunstan won a fourth term in government, defeating the Liberal Party of Australia led by Leader of the Opposition David Tonkin.
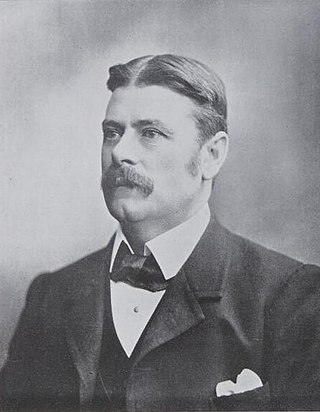
The 1902 South Australian state election was held on 3 May 1902 following the dissolution of both houses. All 42 seats in the South Australian House of Assembly were up for election, and all 18 seats in the Legislative Council. The House had a reduction of 12 seats compared to the previous election. The Council was reduced from 6 members in each of four districts to 6 members from Central District and four from each of North-Eastern, Northern and Southern Districts. The incumbent liberal government led by Premier of South Australia John Jenkins in an informal coalition with the conservatives defeated the United Labor Party (ULP) led by Thomas Price. Each of the 13 districts elected multiple members, with voters casting multiple votes.
State elections were held in South Australia on 6 April 1918. All 46 seats in the South Australian House of Assembly were up for election. The incumbent Liberal Union government led by Premier of South Australia Archibald Peake defeated the opposition Australian Labor Party led by Leader of the Opposition Andrew Kirkpatrick. Each district elected multiple members, with voters casting multiple votes.
State elections were held in South Australia on 9 and 16 April 1921. All 46 seats in the South Australian House of Assembly were up for election. The incumbent Liberal Union government led by Premier of South Australia Henry Barwell defeated the opposition Australian Labor Party led by Leader of the Opposition John Gunn. Each district elected multiple members, with voters casting multiple votes.
Members of the New South Wales Legislative Assembly who served in the 25th parliament of New South Wales held their seats from 1920 to 1922. They were elected at the 1920 state election on 20 March 1920. The Speaker was Daniel Levy with the exception of 13–20 December 1921 when he was replaced by Simon Hickey.
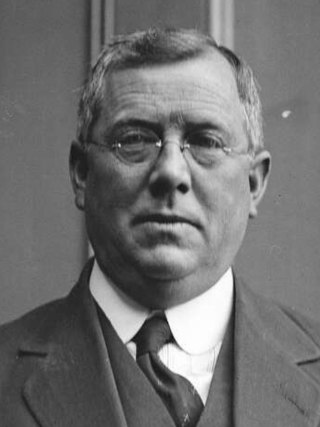
The Dooley ministry (1921) or the first Dooley ministry was the 38th ministry of the New South Wales Government, and was led by the 21st Premier, James Dooley. It was the first of two occasions that Dooley was Premier.
The Dooley ministry (1921–1922) or the Second Dooley ministry was the 40th ministry of the New South Wales Government, and was led by the 21st Premier, James Dooley.
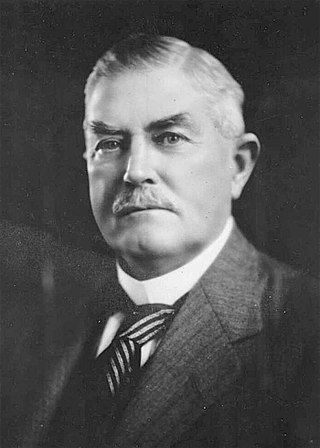
The Fuller ministry (1921) or First Fuller ministry was the 39th ministry of the New South Wales Government, and was led by the 22nd Premier, Sir George Fuller. The ministry covers just seven hours during 20 December 1921, the shortest of any ministry in the history of self-government in the state.
The Fuller ministry (1922–1925) or Second Fuller ministry was the 41st ministry of the New South Wales Government, and was led by the 22nd Premier, Sir George Fuller. This ministry was the second of two occasions where Fuller was Premier.
The 2021 Western Australian state election was held on Saturday, March 13, to elect members to the Parliament of Western Australia, where all 59 seats in the Legislative Assembly and all 36 seats in the Legislative Council were up for election.
SA-Best, formerly known as Nick Xenophon's SA-BEST, is a political party in South Australia. It was founded in 2017 by Nick Xenophon as a state-based partner to his Nick Xenophon Team party. After an unsuccessful 2022 South Australian state election, the party has one representative in the South Australian Legislative Council, Connie Bonaros, whose term expires in 2026.
This is a list of House of Assembly results for the 1924 South Australian state election. Each district elected multiple members.
The 2022 South Australian state election was held on 19 March 2022 to elect members to the 55th Parliament of South Australia. All 47 seats in the House of Assembly, and half the seats in the Legislative Council were up for re-election.
This is a list of House of Assembly results for the 1918 South Australian state election. Each district elected multiple members.