Tasmanian state election, 15 March 2014 Contents | ||||||
---|---|---|---|---|---|---|
Enrolled voters | 366,442 | |||||
Votes cast | 346,423 | Turnout | 94.54 | +0.68 | ||
Informal votes | 16,432 | Informal | 4.74 | +0.30 | ||
Summary of votes by party | ||||||
Party | Primary votes | % | Swing | Seats | Change | |
Liberal | 167,051 | 51.22 | +12.23 | 15 | +5 | |
Labor | 89,130 | 27.33 | −9.55 | 7 | −3 | |
Greens | 45,098 | 13.83 | −7.78 | 3 | −2 | |
Palmer United | 16,198 | 4.97 | +4.97 | 0 | 0 | |
National | 2,655 | 0.81 | +0.81 | 0 | 0 | |
Christians | 1,215 | 0.37 | +0.37 | 0 | 0 | |
Socialist Alliance | 664 | 0.20 | +0.00 | 0 | 0 | |
Independent | 4,152 | 1.27 | −1.05 | 0 | 0 | |
Total | 326,163 | 25 |
This is a list of House of Assembly results for the 2014 Tasmanian election.
Party | Candidate | Votes | % | ±% | |
---|---|---|---|---|---|
Quota | 10,744 | ||||
Liberal | Peter Gutwein (elected 1) | 15,041 | 23.3 | +9.1 | |
Liberal | Michael Ferguson (elected 2) | 14,418 | 22.4 | -2.6 | |
Liberal | Sarah Courtney (elected 3) | 3,046 | 4.7 | +4.7 | |
Liberal | Barry Jarvis | 2,582 | 4.0 | +4.0 | |
Liberal | Leonie McNair | 1,795 | 2.8 | +2.8 | |
Labor | Michelle O'Byrne (elected 4) | 6,852 | 10.6 | -7.6 | |
Labor | Brian Wightman | 5,268 | 8.1 | +3.1 | |
Labor | Senka Mujkic | 1,183 | 1.8 | +1.8 | |
Labor | Andrew Connor | 1,007 | 1.6 | +1.6 | |
Labor | Adam Gore | 692 | 1.1 | +1.1 | |
Greens | Kim Booth (elected 5) | 6,661 | 10.3 | -3.6 | |
Greens | Andrea Dawkins | 467 | 0.7 | +0.7 | |
Greens | Amy Tyler | 369 | 0.6 | +0.6 | |
Greens | Anna Povey | 366 | 0.6 | +0.6 | |
Greens | Anne Layton-Bennett | 334 | 0.5 | +0.5 | |
Palmer United | Tim Parish | 1,147 | 1.8 | +1.8 | |
Palmer United | Chris Dobson | 910 | 1.4 | +1.4 | |
Palmer United | Mark Hines | 672 | 1.0 | +1.0 | |
Palmer United | Brian Gunst | 579 | 0.9 | +0.9 | |
Christians | Ray Kroeze | 680 | 1.1 | +1.1 | |
Independent | Andrew Roberts | 223 | 0.3 | +0.3 | |
Independent | Brett Lucas | 167 | 0.3 | +0.3 | |
Total formal votes | 64,459 | 95.4 | +0.1 | ||
Informal votes | 3,130 | 4.6 | -0.1 | ||
Turnout | 67,589 | 92.9 | -0.9 | ||
Party total votes | |||||
Liberal | 36,882 | 57.2 | +14.6 | ||
Labor | 15,002 | 23.3 | -11.2 | ||
Greens | 8,197 | 12.7 | -8.3 | ||
Palmer United | 3,308 | 5.1 | +5.1 | ||
Christians | 680 | 1.1 | +1.1 | ||
Independent | Andrew Roberts | 223 | 0.3 | +0.3 | |
Independent | Brett Lucas | 167 | 0.3 | +0.3 | |
Liberal hold | Swing | +9.1 | |||
Liberal hold | Swing | –2.6 | |||
Liberal gain from Labor | Swing | +4.7 | |||
Labor hold | Swing | –7.6 | |||
Greens hold | Swing | –3.6 | |||
Party | Candidate | Votes | % | ±% | |
---|---|---|---|---|---|
Quota | 10,716 | ||||
Liberal | Adam Brooks (elected 1) | 16,073 | 25.0 | +14.2 | |
Liberal | Jeremy Rockliff (elected 2) | 15,168 | 23.6 | +6.5 | |
Liberal | Roger Jaensch (elected 4) | 3,009 | 4.7 | +4.7 | |
Liberal | Joan Rylah (elected 5) | 2,633 | 4.1 | +4.1 | |
Liberal | Kyron Howell | 895 | 1.4 | +1.4 | |
Labor | Bryan Green (elected 3) | 6,606 | 10.3 | -7.1 | |
Labor | Brenton Best | 3,648 | 5.7 | -5.3 | |
Labor | Shane Broad | 2,654 | 4.1 | -1.0 | |
Labor | Justine Keay | 1,382 | 2.1 | +2.1 | |
Labor | Darryl Bessell | 653 | 1.0 | +1.0 | |
Palmer United | Kevin Morgan | 2,291 | 3.6 | +3.6 | |
Palmer United | Steve Green | 847 | 1.3 | +1.3 | |
Palmer United | Kev Deakin | 539 | 0.8 | +0.8 | |
Palmer United | Scott Alexander | 533 | 0.8 | +0.8 | |
Palmer United | Julian Brown | 404 | 0.6 | +0.6 | |
Greens | Paul O'Halloran | 3,294 | 5.1 | -3.8 | |
Greens | Melissa Houghton | 409 | 0.6 | -0.5 | |
Greens | Philip Nicholas | 314 | 0.5 | +0.5 | |
Greens | Sally O'Wheel | 253 | 0.4 | +0.4 | |
Greens | Chris Cornell | 249 | 0.4 | +0.4 | |
National | Ken Dorsey | 747 | 1.2 | +1.2 | |
National | Benji Benjamin | 507 | 0.8 | +0.8 | |
National | Liz van der Linde-Keep | 135 | 0.2 | +0.2 | |
Christians | Kevin Swarts | 535 | 0.8 | +0.8 | |
Independent | Mick Anderson | 412 | 0.6 | +0.6 | |
Independent | Tony Brown | 101 | 0.2 | +0.2 | |
Total formal votes | 64,291 | 94.9 | -0.2 | ||
Informal votes | 3,466 | 5.1 | +0.2 | ||
Turnout | 67,757 | 93.8 | -0.3 | ||
Party total votes | |||||
Liberal | 37,778 | 58.8 | +13.6 | ||
Labor | 14,943 | 23.2 | -17.0 | ||
Palmer United | 4,614 | 7.2 | +7.2 | ||
Greens | 4,519 | 7.0 | -6.8 | ||
National | 1,389 | 2.2 | +2.2 | ||
Christians | 535 | 0.8 | +0.8 | ||
Independent | Mick Anderson | 412 | 0.6 | +0.6 | |
Independent | Tony Brown | 101 | 0.2 | +0.2 | |
Liberal hold | Swing | +14.2 | |||
Liberal hold | Swing | +6.5 | |||
Liberal gain from Labor | Swing | +4.7 | |||
Liberal gain from Greens | Swing | +4.1 | |||
Labor hold | Swing | –7.1 | |||
Party | Candidate | Votes | % | ±% | |
---|---|---|---|---|---|
Quota | 10,660 | ||||
Liberal | Matthew Groom (elected 2) | 13,829 | 21.6 | +6.5 | |
Liberal | Elise Archer (elected 4) | 6,701 | 10.5 | +5.8 | |
Liberal | Robert Mallett | 2,080 | 3.3 | +3.3 | |
Liberal | Deborah De Williams | 1,052 | 1.6 | +1.6 | |
Liberal | René Kling | 823 | 1.3 | +1.3 | |
Labor | Scott Bacon (elected 1) | 14,469 | 22.6 | +11.1 | |
Labor | Madeleine Ogilvie (elected 5) | 2,156 | 3.4 | +2.4 | |
Labor | Julian Amos | 1,917 | 3.0 | +3.0 | |
Labor | Alphonse Mulumba | 1,587 | 2.5 | +2.5 | |
Labor | Sharon Carnes | 1,482 | 2.3 | +2.3 | |
Greens | Cassy O'Connor (elected 3) | 9,694 | 15.2 | -1.0 | |
Greens | Bill Harvey | 1,614 | 2.5 | +2.5 | |
Greens | Penelope Ann | 934 | 1.5 | +0.2 | |
Greens | Philip Cocker | 695 | 1.1 | +1.1 | |
Greens | Alan Whykes | 615 | 1.0 | +1.0 | |
Palmer United | Barbara Etter | 737 | 1.2 | +1.2 | |
Palmer United | Rob Newitt | 369 | 0.6 | +0.6 | |
Palmer United | Justin Stringer | 357 | 0.6 | +0.6 | |
Palmer United | Charles Forrest | 303 | 0.5 | +0.5 | |
Palmer United | Mark Grube | 254 | 0.4 | +0.4 | |
Independent | Marti Zucco | 788 | 1.2 | +1.2 | |
Independent | Hans Willink | 413 | 0.6 | +0.6 | |
Socialist Alliance | Shaine Stephen | 300 | 0.5 | +0.5 | |
Independent | Leo Foley | 207 | 0.3 | +0.3 | |
National | Vlad Gala | 75 | 0.1 | +0.1 | |
National | Julian Edwards | 61 | 0.1 | +0.1 | |
National | Domenic Allocca | 48 | 0.1 | +0.1 | |
Independent | Freddy Hill | 152 | 0.2 | +0.2 | |
Independent | Lucas Noyes | 130 | 0.2 | +0.2 | |
Independent | Michael Swanton | 114 | 0.2 | +0.2 | |
Total formal votes | 63,956 | 95.2 | -1.0 | ||
Informal votes | 3,218 | 4.8 | +1.0 | ||
Turnout | 67,174 | 92.7 | -0.3 | ||
Party total votes | |||||
Liberal | 24,485 | 38.3 | +8.5 | ||
Labor | 21,611 | 33.8 | -2.5 | ||
Greens | 13,552 | 21.2 | -3.7 | ||
Palmer United | 2,020 | 3.2 | +3.2 | ||
Independent | Marti Zucco | 788 | 1.2 | +1.2 | |
Independent | Hans Willink | 413 | 0.6 | +0.6 | |
Socialist Alliance | 300 | 0.5 | -0.1 | ||
Independent | Leo Foley | 207 | 0.3 | +0.3 | |
National | 184 | 0.3 | +0.3 | ||
Independent | Freddy Hill | 152 | 0.2 | +0.2 | |
Independent | Lucas Noyes | 130 | 0.2 | +0.2 | |
Independent | Michael Swanton | 114 | 0.2 | +0.2 | |
Liberal hold | Swing | +6.5 | |||
Liberal hold | Swing | +5.8 | |||
Labor hold | Swing | +11.1 | |||
Labor hold | Swing | +2.4 | |||
Greens hold | Swing | –1.0 | |||
Party | Candidate | Votes | % | ±% | |
---|---|---|---|---|---|
Quota | 11,184 | ||||
Liberal | Will Hodgman (elected 1) | 23,589 | 35.2 | +3.5 | |
Liberal | Jacquie Petrusma (elected 2) | 4,463 | 6.7 | +2.8 | |
Liberal | Paul Harriss (elected 5) | 3,646 | 5.4 | +5.4 | |
Liberal | Nic Street | 1,122 | 1.7 | +1.7 | |
Liberal | Sue Bastone | 623 | 0.9 | +0.9 | |
Labor | Lara Giddings (elected 3) | 11,035 | 16.4 | +1.3 | |
Labor | David O'Byrne | 5,620 | 8.4 | +0.8 | |
Labor | Julie Dick | 1,372 | 2.0 | +2.0 | |
Labor | Heather Chong | 760 | 1.1 | +1.1 | |
Labor | Russell Mitchell | 413 | 0.6 | +0.6 | |
Greens | Nick McKim (elected 4) | 9,013 | 13.4 | -10.7 | |
Greens | Rosalie Woodruff | 1,110 | 1.7 | +1.7 | |
Greens | Simon Burnett | 454 | 0.7 | +0.7 | |
Greens | Zoe Kean | 354 | 0.5 | +0.5 | |
Greens | Richard Atkinson | 334 | 0.5 | +0.5 | |
Palmer United | Debra Thurley | 743 | 1.1 | +1.1 | |
Palmer United | John Peers | 631 | 0.9 | +0.9 | |
Palmer United | Michael Figg | 413 | 0.6 | +0.6 | |
Palmer United | Con Spiliopoulous | 391 | 0.6 | +0.6 | |
Palmer United | Luke Rutherford | 320 | 0.5 | +0.5 | |
Socialist Alliance | Jenny Forward | 364 | 0.5 | +0.1 | |
National | Matt Holloway | 174 | 0.3 | +0.3 | |
National | Penny Lane | 97 | 0.1 | +0.1 | |
National | Myrtle Wakeling | 62 | 0.1 | 0.1 | |
Total formal votes | 67,103 | 96.0 | +0.2 | ||
Informal votes | 2,790 | 4.0 | -0.2 | ||
Turnout | 69,893 | 94.2 | -0.5 | ||
Party total votes | |||||
Liberal | 33,443 | 49.8 | +8.6 | ||
Labor | 19,200 | 28.6 | -1.9 | ||
Greens | 11,265 | 16.8 | -10.6 | ||
Palmer United | 2,498 | 3.7 | +3.7 | ||
Socialist Alliance | 364 | 0.5 | +0.1 | ||
National | 333 | 0.5 | +0.5 | ||
Liberal hold | Swing | +3.5 | |||
Liberal hold | Swing | +2.8 | |||
Liberal gain from Labor | Swing | +5.4 | |||
Labor hold | Swing | +1.3 | |||
Greens hold | Swing | -10.7 | |||
Party | Candidate | Votes | % | ±% | |
---|---|---|---|---|---|
Quota | 11,060 | ||||
Liberal | Rene Hidding (elected 1) | 11,097 | 16.7 | +4.9 | |
Liberal | Guy Barnett (elected 2) | 9,741 | 14.7 | +14.7 | |
Liberal | Mark Shelton (elected 4) | 8,060 | 12.1 | +3.9 | |
Liberal | Martyn Evans | 3,005 | 4.5 | +4.5 | |
Liberal | Bertrand Cadart | 2,560 | 3.9 | +3.9 | |
Labor | Rebecca White (elected 3) | 8,589 | 12.9 | +2.9 | |
Labor | David Llewellyn (elected 5) | 5,262 | 7.9 | -2.4 | |
Labor | Bob Gordon | 2,724 | 4.1 | +4.1 | |
Labor | Darren Clark | 1,080 | 1.6 | +1.6 | |
Labor | Jessey Dillon | 719 | 1.1 | +1.1 | |
Greens | Tim Morris | 5,140 | 7.7 | -6.4 | |
Greens | Hannah Rubenach | 668 | 1.0 | +1.0 | |
Greens | Pip Brinklow | 655 | 1.0 | +1.0 | |
Greens | Stephanie Taylor | 604 | 0.9 | +0.9 | |
Greens | Glenn Millar | 498 | 0.8 | +0.8 | |
Palmer United | Quentin Von Stieglitz | 1,658 | 2.5 | +2.5 | |
Palmer United | Wayne Shoobridge | 1,233 | 1.9 | +1.9 | |
Palmer United | Mark Grewar | 867 | 1.3 | +1.3 | |
Independent | Paul Belcher | 1,252 | 1.9 | +1.9 | |
National | Craig Davey | 295 | 0.4 | +0.4 | |
National | Brett Hall | 243 | 0.4 | +0.4 | |
National | Anne Salt | 122 | 0.2 | +0.2 | |
National | Leo Perotti | 89 | 0.1 | +0.1 | |
Independent | Murray Stewart | 193 | 0.3 | +0.3 | |
Total formal votes | 66,354 | 94.5 | -0.5 | ||
Informal votes | 3,828 | 5.5 | +0.5 | ||
Turnout | 70,182 | 93.8 | +0.1 | ||
Party total votes | |||||
Liberal | 34,463 | 51.9 | +15.8 | ||
Labor | 18,374 | 27.7 | -15.1 | ||
Greens | 7,565 | 11.4 | -9.7 | ||
Palmer United | 3,758 | 5.7 | +5.7 | ||
Independent | Paul Belcher | 1,252 | 1.9 | +1.9 | |
National | 749 | 1.1 | +1.1 | ||
Independent | Murray Stewart | 193 | 0.3 | +0.3 | |
Liberal hold | Swing | +4.9 | |||
Liberal hold | Swing | +14.7 | |||
Liberal gain from Greens | Swing | +3.9 | |||
Labor hold | Swing | +2.9 | |||
Labor hold | Swing | –2.4 | |||
The Tasmanian Greens are a political party in Australia which developed from numerous environmental campaigns in Tasmania, including the flooding of Lake Pedder and the Franklin Dam campaign. They form a part of the Australian Greens.
The House of Assembly, or Lower House, is one of the two chambers of the Parliament of Tasmania in Australia. The other is the Legislative Council or Upper House. It sits in Parliament House in the state capital, Hobart.
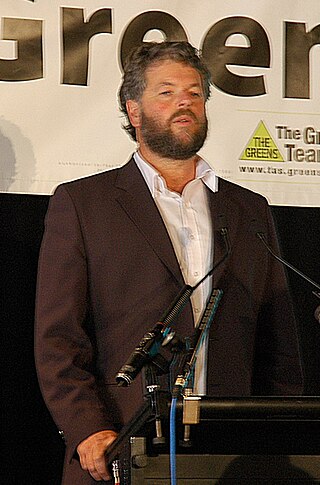
Kim Dion Booth is a former Australian politician. He was the leader of the Tasmanian Greens from April 2014 to May 2015, and represented the Division of Bass in the Tasmanian House of Assembly.
The electoral division of Rumney is one of the 15 electoral divisions in the Tasmanian Legislative Council. The division is located in Southern Tasmania to the east of the division of Pembroke.
The 1912 Tasmanian state election was held on Tuesday, 30 April 1912 in the Australian state of Tasmania to elect 30 members of the Tasmanian House of Assembly. The election used the Hare-Clark proportional representation system — six members were elected from each of five electorates.
The 1931 Tasmanian state election was held on 9 May 1931 in the Australian state of Tasmania to elect 30 members of the Tasmanian House of Assembly. The election used the Hare-Clark proportional representation system — six members were elected from each of five electorates. For the first time, voting was compulsory, resulting in a high voter turnout.
The 1959 Tasmanian state election was held on 2 May 1959 in the Australian state of Tasmania to elect 35 members of the Tasmanian House of Assembly. The number of members were increased from this election from 30 to 35. The election used the Hare-Clark proportional representation system — seven members were elected from each of five electorates.
The 2010 Tasmanian state election was held on 20 March 2010 to elect members to the Tasmanian House of Assembly. The 12-year incumbent Labor government, led by Premier of Tasmania David Bartlett, won a fourth consecutive term against the Liberal opposition, led by Will Hodgman, after Labor formed a minority government with the support of the Greens.
Paul Basil O'Halloran is a former Australian politician.
The 2014 Tasmanian state election was held on 15 March 2014 to elect all 25 members to the House of Assembly. The 16-year incumbent Labor government, led by the Premier of Tasmania Lara Giddings, sought to win a fifth consecutive term in government, but was defeated by the Liberal opposition, led by Opposition Leader Will Hodgman, in a landslide victory. Also contesting the election was the Greens led by Nick McKim. The Palmer United Party made a significant effort in the election.
The 2018 Tasmanian state election was held on 3 March 2018 to elect all 25 members of the Tasmanian House of Assembly.
This is a list of members of the Tasmanian House of Assembly, elected at the 2014 state election.
Periodic elections for the Tasmanian Legislative Council were held on 3 May 2014. The two seats up for election were the electoral division of Huon and the electoral division of Rosevears. These seats were last contested in 2008.
The 2021 Tasmanian state election was held on 1 May 2021 to elect all 25 members to the Tasmanian House of Assembly.
This is a list of House of Assembly results for the 2018 Tasmanian election.

The Tasmanian Nationals are a political party in the Australian state of Tasmania, aligned with the National Party of Australia. The party is not currently registered with the Tasmanian Electoral Commission, and is not separately registered with the Australian Electoral Commission, unlike the other state branches of the Nationals.
The Australian Federation Party (AFP), also known as AusFeds and formerly known as the Country Alliance and the Australian Country Party, is an Australian political party. Founded in 2004 by four rural Victorians, the party lodged its initial registration with the Victorian Electoral Commission on 15 August 2005.
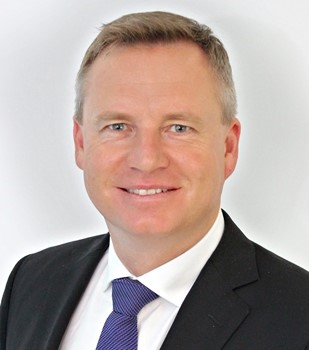
The 2024 Tasmanian state election was held on 23 March 2024 to elect all 35 members to the House of Assembly.
This is a list of House of Assembly results for the 1913 Tasmanian election.
This is a list of House of Assembly results for the 2021 Tasmanian state election.