Results of the South Australian state election, 2018 (House of Assembly)

Last updated

South Australian state election, 17 March 2018 [1] [2] [3]
House of Assembly
<< 20142022 >>

Contents

Enrolled voters1,201,775
Votes cast1,093,584 Turnout 91.00−0.94
Informal votes44,871Informal4.10+1.01
Summary of votes by party
PartyPrimary votes%SwingSeatsChange
  Liberal 398,18237.97−6.8125+3
  Labor 343,89632.79−3.0119−4
  SA-BEST 148,36014.15+14.1500
  Greens 69,8266.66−2.0500
  Conservatives 31,8263.03−3.2100
  Dignity 15,5651.48+0.9000
  Animal Justice 3,2620.31+0.3100
 Danig7320.07+0.0700
  Stop Population Growth Now 2840.03+0.0300
  Independent 36,7803.51−0.223+1
Total1,048,713  47 
Two-party-preferred
  Liberal 544,65451.94–1.07
  Labor 504,05948.06+1.07

This is a list of House of Assembly results for the 2018 South Australian state election.

South Australian House of Assembly lower house of the Parliament of South Australia

The House of Assembly, or lower house, is one of the two chambers of the Parliament of South Australia. The other is the Legislative Council. It sits in Parliament House in the state capital, Adelaide.

Results by district

Adelaide

South Australian state election, 2018: Adelaide [4]
PartyCandidateVotes%±
Liberal Rachel Sanderson 10,22647.2−2.1
Labor Jo Chapley7,75035.8+0.5
Greens Robert Simms 2,73912.6+0.7
Dignity Betty-Jean Price9464.4+1.1
Total formal votes21,66197.8−0.3
Informal votes4872.2+0.3
Turnout 22,14888.8+2.4
Two-party-preferred result
Liberal Rachel Sanderson 11,04351.0−2.0
Labor Jo Chapley10,61849.0+2.0
Liberal hold Swing −2.0

Badcoe

South Australian state election, 2018: Badcoe [5]
PartyCandidateVotes%±
Labor Jayne Stinson 8,28638.7−2.8
Liberal Lachlan Clyne6,84532.0−8.6
SA-BEST Kate Bickford3,26115.2+15.2
Greens Stef Rozitis1,6807.9−3.9
Conservatives Robyn Munro5332.5−1.8
Independent John Woodward3971.9+1.9
Dignity Lily Durkin3841.8+0.7
Total formal votes21,38696.0−0.7
Informal votes9014.0+0.7
Turnout 22,28790.5−1.3
Two-party-preferred result
Labor Jayne Stinson 11,86755.5+1.4
Liberal Lachlan Clyne9,51944.5−1.4
Labor hold Swing +1.4

Black

South Australian state election, 2018: Black [6]
PartyCandidateVotes%±
Liberal David Speirs 12,53850.6+8.2
Labor Randall Wilson7,87031.7−3.7
Greens Dami Barnes1,7026.9−0.8
Independent Rob De Jonge1,4225.7+5.7
Conservatives Lionel Zschech6982.8−1.6
Dignity Anastasia Svetlichny5612.3+2.3
Total formal votes24,79196.1−1.3
Informal votes1,0013.9+1.3
Turnout 25,79292.5+0.4
Two-party-preferred result
Liberal David Speirs 14,54658.7+6.4
Labor Randall Wilson10,24541.3−6.4
Liberal hold Swing +6.4

Bragg

South Australian state election, 2018: Bragg [7]
PartyCandidateVotes%±
Liberal Vickie Chapman 14,56763.1−0.8
Labor Rick Sarre5,51323.9−0.4
Greens Neil Zwaans2,0729.0−2.1
Dignity Taylah Neagle9274.0+3.8
Total formal votes23,07997.7−0.5
Informal votes5412.3+0.5
Turnout 23,62091.8+0.5
Two-party-preferred result
Liberal Vickie Chapman 15,56667.4+0.3
Labor Rick Sarre7,51332.6−0.3
Liberal hold Swing +0.3

Chaffey

South Australian state election, 2018: Chaffey [8]
PartyCandidateVotes%±
Liberal Tim Whetstone 9,48946.1−17.6
SA-BEST Michelle Campbell5,13624.9+24.9
Labor Sim Singh-Malhi3,97219.3+1.7
Conservatives Trevor Scott1,3666.6−6.6
Greens Philip Pointer4042.0−3.6
Dignity Richard Challis2291.1+1.1
Total formal votes20,59695.7−0.9
Informal votes9354.3+0.9
Turnout 21,53191.6−1.3
Two-party-preferred result
Liberal Tim Whetstone 13,85767.3−6.7
Labor Sim Singh-Malhi6,73932.7+6.7
Two-candidate-preferred result
Liberal Tim Whetstone 12,05958.6−15.4
SA-BEST Michelle Campbell8,53741.5+41.5
Liberal hold Swing N/A

Cheltenham

South Australian state election, 2018: Cheltenham [9]
PartyCandidateVotes%±
Labor Jay Weatherill 11,66152.4−2.9
Liberal Penny Pratt4,95422.3−7.2
SA-BEST John Noonan3,36915.1+15.1
Greens Steffi Medrow1,4036.3−2.5
Dignity Madeline McCaul5372.4+2.4
Independent Vincent Scali3371.5+1.5
Total formal votes22,26194.9−1.7
Informal votes1,1955.1+1.7
Turnout 23,45690.0+5.0
Two-party-preferred result
Labor Jay Weatherill 14,66265.9+1.5
Liberal Penny Pratt7,59934.1−1.5
Labor hold Swing +1.5

Colton

South Australian state election, 2018: Colton [10]
PartyCandidateVotes%±
Liberal Matt Cowdrey 11,68547.6−2.4
Labor Angela Vaughan7,73331.5−7.7
SA-BEST Jassmine Wood3,45914.1+14.1
Greens Paul Petherick1,4045.7−1.7
Dignity Ted Evans2711.1+1.1
Total formal votes24,55296.8−0.6
Informal votes8083.2+0.6
Turnout 25,36091.9+3.2
Two-party-preferred result
Liberal Matt Cowdrey 14,21157.9+4.0
Labor Angela Vaughan10,34142.1−4.0
Liberal hold Swing +4.0

Croydon

South Australian state election, 2018: Croydon [11]
PartyCandidateVotes%±
Labor Peter Malinauskas 11,73958.0−2.3
Liberal Daria Hextell3,18515.7−7.8
SA-BEST Julia Karpathakis2,12510.5+10.5
Greens Nathan Lange1,4247.0−3.3
Animal Justice Millie Hammerstein8034.0+4.0
Conservatives Rachael Runner3651.8−3.0
Dignity Lucy McGinley2411.2+1.2
Independent Michael Lesiw1760.9+0.9
DanigGabor Gesti1720.9+0.9
Total formal votes20,23093.0−3.4
Informal votes1,5117.0+3.4
Turnout 21,74188.3+5.3
Two-party-preferred result
Labor Peter Malinauskas 15,04474.4+3.2
Liberal Daria Hextell5,18625.6−3.2
Labor hold Swing +3.2

Davenport

South Australian state election, 2018: Davenport [12]
PartyCandidateVotes%±
Liberal Steve Murray 9,30642.1−0.3
Labor Jonette Thorsteinsen5,27523.9+3.8
SA-BEST Karen Hockley4,60420.8+20.8
Greens John Photakis1,6007.2−0.2
Independent Dan Golding1,3176.0+6.0
Total formal votes22,10296.5−1.3
Informal votes7923.5+1.3
Turnout 22,89492.3−0.7
Two-party-preferred result
Liberal Steve Murray 12,99258.8−0.7
Labor Jonette Thorsteinsen9,11041.2+0.7
Liberal hold Swing −0.7

Dunstan

South Australian state election, 2018: Dunstan [13]
PartyCandidateVotes%±
Liberal Steven Marshall 10,51747.0−3.4
Labor Matt Loader6,51429.1−6.6
SA-BEST Jack Noonan2,90113.0+13.0
Greens Harriet De Kok1,8928.4−2.7
Dignity Ben Wilson 5712.5+0.4
Total formal votes22,39597.4−0.4
Informal votes5992.6+0.4
Turnout 22,99490.5+1.1
Two-party-preferred result
Liberal Steven Marshall 12,56656.1+2.5
Labor Matt Loader9,82943.9−2.5
Liberal hold Swing +2.5

Elder

South Australian state election, 2018: Elder [14]
PartyCandidateVotes%±
Liberal Carolyn Habib 9,81242.3−5.1
Labor Annabel Digance 7,34731.7−2.3
SA-BEST Michael Slattery3,25714.0+14.0
Greens Jody Moate1,6797.2−3.5
Conservatives Shawn Van Groesen6692.9−1.7
Dignity Nick Schumi4331.9−1.3
Total formal votes23,19796.7−0.2
Informal votes7943.3+0.2
Turnout 23,99191.9+2.5
Two-party-preferred result
Liberal Carolyn Habib 12,60954.4+0.3
Labor Annabel Digance 10,58845.6−0.3
Liberal hold Swing +0.3

Elizabeth

South Australian state election, 2018: Elizabeth [15]
PartyCandidateVotes%±
Labor Lee Odenwalder 11,82851.0+1.1
SA-BEST Phil Gallasch4,35118.8+18.8
Liberal Sharka Byrne4,08317.6−11.3
Greens Wendy Morgan1,5706.8−0.7
Conservatives John Mathiesen1,3535.8−5.2
Total formal votes23,18594.3−1.5
Informal votes1,4015.7+1.5
Turnout 24,58686.6+2.5
Two-party-preferred result
Labor Lee Odenwalder 15,68667.7+6.6
Liberal Sharka Byrne7,49932.3−6.6
Two-candidate-preferred result
Labor Lee Odenwalder 14,80863.9+2.9
SA-BEST Phil Gallasch8,37736.1+36.1
Labor hold Swing N/A

Enfield

South Australian state election, 2018: Enfield [16]
PartyCandidateVotes%±
Labor John Rau 8,88240.9−5.1
Liberal Deepa Mathew5,76126.6−10.5
SA-BEST Carol Martin4,00418.5+18.5
Greens Cassie Alvey1,8028.3−0.0
Conservatives Steve Edmonds7183.3−2.9
Dignity Emma Cresdee5262.4+2.1
Total formal votes21,69395.5−0.7
Informal votes1,0174.5+0.7
Turnout 22,71088.6+6.1
Two-party-preferred result
Labor John Rau 12,55457.9+2.3
Liberal Deepa Mathew9,13942.1−2.3
Labor hold Swing +2.3

Finniss

South Australian state election, 2018: Finniss [17]
PartyCandidateVotes%±
Liberal David Basham 9,31943.6−8.6
SA-BEST Joe Hill5,51525.8+25.8
Labor Russell Skinner3,64817.1−7.5
Greens Marc Mullette1,6707.8−4.3
Conservatives Bruce Hicks1,2075.7−4.9
Total formal votes21,35997.2+0.1
Informal votes6262.8−0.1
Turnout 21,98592.3+2.1
Two-party-preferred result
Liberal David Basham 13,71864.2+1.1
Labor Russell Skinner7,64135.8−1.1
Two-candidate-preferred result
Liberal David Basham 11,66954.6−8.5
SA-BEST Joe Hill9,69045.4+45.4
Liberal hold Swing N/A

Flinders

South Australian state election, 2018: Flinders [18]
PartyCandidateVotes%±
Liberal Peter Treloar 13,56568.2−3.5
Labor Julie Watson3,59818.1+2.5
Greens Ian Dudley1,4297.2+0.9
Conservatives Tony Parker1,3006.5+0.2
Total formal votes19,89297.0−0.6
Informal votes6063.0+0.6
Turnout 20,49890.1+0.3
Two-party-preferred result
Liberal Peter Treloar 15,17676.3−2.6
Labor Julie Watson4,71623.7+2.6
Liberal hold Swing −2.6

Florey

South Australian state election, 2018: Florey [19]
PartyCandidateVotes%±
Labor Rik Morris7,45132.8−17.1
Independent Frances Bedford 6,96230.6+30.6
Liberal Gagan Sharma4,76821.0−13.4
Conservatives John Peake1,1325.0−4.1
Greens Adam Gatt1,1014.8−1.8
Animal Justice Geoff Russell8853.9+3.9
Dignity Suzi Waechter4181.8+1.8
Total formal votes22,71793.3−2.8
Informal votes1,6216.7+2.8
Turnout 24,33891.0−0.4
Two-party-preferred result
Labor Rik Morris13,85261.0+1.9
Liberal Gagan Sharma8,86539.0−1.9
Two-candidate-preferred result
Independent Frances Bedford 12,74656.1+56.1
Labor Rik Morris9,97143.9−15.2
Independent gain from Labor Swing N/A

Frome

South Australian state election, 2018: Frome [20]
PartyCandidateVotes%±
Independent Geoff Brock 9,51646.0+2.1
Liberal Kendall Jackson7,92938.3+3.0
Labor Annette Elliot2,07710.0−2.4
Greens Paul Birkwood6223.0+0.2
Dignity Cat Connor5562.7+2.7
Total formal votes20,70096.7−0.9
Informal votes7173.3+0.9
Turnout 21,41791.8−1.2
Two-party-preferred result
Liberal Kendall Jackson12,64861.1+1.3
Labor Annette Elliot8,05238.9−1.3
Two-candidate-preferred result
Independent Geoff Brock 12,04358.2−1.2
Liberal Kendall Jackson8,65741.8+1.2
Independent hold Swing −1.2

Gibson

South Australian state election, 2018: Gibson [21]
PartyCandidateVotes%±
Liberal Corey Wingard 10,96548.1+2.4
Labor Matthew Carey5,84325.6−9.1
SA-BEST Kris Hanna 4,10718.0+18.0
Greens Gwydion Rozitisolds1,3265.8−3.0
Dignity Garry Connor5702.5+1.5
Total formal votes22,81196.8−0.6
Informal votes7623.2+0.6
Turnout 23,57391.3+3.1
Two-party-preferred result
Liberal Corey Wingard 13,53759.3+5.6
Labor Matthew Carey9,27440.7−5.6
Liberal hold Swing +5.6

Giles

South Australian state election, 2018: Giles [22]
PartyCandidateVotes%±
Labor Eddie Hughes 9,17647.0−2.7
SA-BEST Tom Antonio5,07025.9+25.9
Liberal Mark Walsh3,61118.5−20.8
Greens Anna Taylor7133.6−1.3
Conservatives Cheryl Kaminski5022.6−3.6
Dignity Cyanne Westerman4702.4+2.4
Total formal votes19,54296.7−0.3
Informal votes6623.3+0.3
Turnout 20,20486.0−1.5
Two-party-preferred result
Labor Eddie Hughes 12,73265.2+10.0
Liberal Mark Walsh6,81034.8−10.0
Two-candidate-preferred result
Labor Eddie Hughes 11,22257.4+2.2
SA-BEST Tom Antonio8,32042.6+42.6
Labor hold Swing +2.2

Hammond

South Australian state election, 2018: Hammond [23]
PartyCandidateVotes%±
Liberal Adrian Pederick 11,47552.0−5.1
SA-BEST Kelly Gladigau5,01022.7+22.7
Labor Mat O'Brien3,56016.1−7.7
Greens Simon Hope1,0624.8−1.3
Conservatives Declan Paton9544.3−4.6
Total formal votes22,06196.3−0.5
Informal votes8433.7+0.5
Turnout 22,90491.5+5.6
Two-party-preferred result
Liberal Adrian Pederick 15,32569.5+2.7
Labor Mat O'Brien6,73630.5−2.7
Two-candidate-preferred result
Liberal Adrian Pederick 13,69762.1−4.7
SA-BEST Kelly Gladigau8,36437.9+37.9
Liberal hold Swing N/A

Hartley

South Australian state election, 2018: Hartley [24]
PartyCandidateVotes%±
Liberal Vincent Tarzia 8,61940.4−7.3
SA-BEST Nick Xenophon 5,31924.9+24.9
Labor Grace Portolesi 5,11724.0−15.4
Greens Lauren Zwaans1,0284.8−3.1
Independent Marijka Ryan5262.5+2.5
Conservatives Bob Jackson4752.2−2.8
Dignity Rick Neagle2391.1+1.1
Total formal votes21,32395.3−1.6
Informal votes1,0614.7+1.6
Turnout 22,38491.4+1.4
Two-party-preferred result
Liberal Vincent Tarzia 12,31657.8+4.7
Labor Grace Portolesi 9,00742.2−4.7
Liberal hold Swing +4.7

Heysen

South Australian state election, 2018: Heysen [25]
PartyCandidateVotes%±
Liberal Josh Teague 9,22740.7−13.4
SA-BEST John Illingworth5,51424.3+24.3
Labor Tony Webb4,12318.2−2.1
Greens Lynton Vonow2,55711.3−8.3
Conservatives Lynette Stevenson7853.5+3.0
Dignity Andrew Ey4672.1−2.7
Total formal votes22,67396.7−0.6
Informal votes7673.3+0.6
Turnout 23,44093.7+2.0
Two-party-preferred result
Liberal Josh Teague 13,25958.5−3.8
Labor Tony Webb9,41441.5+3.8
Two-candidate-preferred result
Liberal Josh Teague 11,74951.8−10.4
SA-BEST John Illingworth10,92448.2+48.2
Liberal hold Swing N/A

Hurtle Vale

South Australian state election, 2018: Hurtle Vale [26]
PartyCandidateVotes%±
Labor Nat Cook 9,66842.0+5.4
Liberal Aaron Duff7,23931.5−4.5
SA-BEST Michael O'Brien3,64815.9+15.9
Greens Nikki Mortier1,1234.9−1.8
Conservatives Bruce Malcolm8853.8−4.4
Dignity Donovan Cresdee4461.9+1.9
Total formal votes23,00995.3−1.2
Informal votes1,1374.7+1.2
Turnout 24,14692.5+3.6
Two-party-preferred result
Labor Nat Cook 12,72655.3+4.0
Liberal Aaron Duff10,28344.7−4.0
Labor hold Swing +4.0

Kaurna

South Australian state election, 2018: Kaurna [27]
PartyCandidateVotes%±
Labor Chris Picton 13,16257.6+10.9
Liberal Simon McMahon7,34232.1+0.5
Greens Sean Cullen-MacAskill2,35810.3+1.7
Total formal votes22,86295.7−0.9
Informal votes1,0254.3+0.9
Turnout 23,88791.0+7.8
Two-party-preferred result
Labor Chris Picton 14,84364.9+5.7
Liberal Simon McMahon8,01935.1−5.7
Labor hold Swing +5.7

Kavel

South Australian state election, 2018: Kavel [28]
PartyCandidateVotes%±
Liberal Dan Cregan 10,37448.1−6.3
SA-BEST Andrew Stratford4,21719.6+19.6
Labor Glen Dallimore3,43615.9−6.0
Greens Ian Grosser1,9639.1−7.2
Animal Justice Louise Pfeiffer6443.0+3.0
Conservatives Howard Hollow6152.9−4.0
Dignity Cristina Rodert3131.5+0.9
Total formal votes21,56296.4−0.8
Informal votes8163.6+0.8
Turnout 22,37892.7+4.1
Two-party-preferred result
Liberal Dan Cregan 13,96564.8+1.0
Labor Glen Dallimore7,59735.2−1.0
Two-candidate-preferred result
Liberal Dan Cregan 12,87859.7−4.1
SA-BEST Andrew Stratford8,68440.3+40.3
Liberal hold Swing N/A

King

South Australian state election, 2018: King [29]
PartyCandidateVotes%±
Liberal Paula Luethen 8,93236.8−4.7
Labor Julie Duncan8,29834.1−7.0
SA-BEST Giles Rositano4,51918.6+18.6
Greens Damon Adams1,4125.8−0.6
Conservatives Gary Balfort1,1384.7−3.7
Total formal votes24,29996.0−0.3
Informal votes1,0164.0+0.3
Turnout 25,31593.1+4.6
Two-party-preferred result
Liberal Paula Luethen 12,32850.7+0.7
Labor Julie Duncan11,97149.3−0.7
Liberal gain from Labor Swing +0.7

Lee

South Australian state election, 2018: Lee [30]
PartyCandidateVotes%±
Labor Stephen Mullighan 9,84542.5+0.4
Liberal Steven Rypp8,20335.4−5.5
SA-BEST Andy Legrand2,95312.7+12.7
Greens Patrick O'Sullivan1,0234.4−1.6
Conservatives Vicki Jessop7313.2−0.7
Dignity Tiffany Littler3041.3+1.3
DanigAristidis Kerpelis1270.5+0.5
Total formal votes23,18695.6−1.0
Informal votes1,0654.4+1.0
Turnout 24,25191.5+2.1
Two-party-preferred result
Labor Stephen Mullighan 12,48553.8+2.3
Liberal Steven Rypp10,70146.2−2.3
Labor hold Swing +2.3

Light

South Australian state election, 2018: Light [31]
PartyCandidateVotes%±
Labor Tony Piccolo 11,90652.8+6.0
Liberal Karen McColl7,52733.4−7.0
Greens Felicity Green1,6067.1+1.3
Conservatives Carl Teusner1,5256.8−0.3
Total formal votes22,56495.9−1.2
Informal votes9534.1+1.2
Turnout 23,51790.5+8.4
Two-party-preferred result
Labor Tony Piccolo 13,51659.9+5.9
Liberal Karen McColl9,04840.1−5.9
Labor hold Swing +5.9

MacKillop

South Australian state election, 2018: MacKillop [32]
PartyCandidateVotes%±
Liberal Nick McBride 11,34654.8−10.2
SA-BEST Tracy Hill3,90218.8+18.8
Labor Hilary Wigg2,0229.8−4.9
Conservatives Richard Bateman1,7998.7+1.1
Independent Jon Ey1,1425.5+5.5
Greens Donella Peters4922.4−3.3
Total formal votes20,70395.9−1.2
Informal votes8824.1+1.2
Turnout 21,58592.4−0.9
Two-party-preferred result
Liberal Nick McBride 15,51975.0−1.7
Labor Hilary Wigg5,18425.0+1.7
Two-candidate-preferred result
Liberal Nick McBride 13,99567.6−9.1
SA-BEST Tracy Hill6,70832.4+32.4
Liberal hold Swing N/A

Mawson

South Australian state election, 2018: Mawson [33]
PartyCandidateVotes%±
Liberal Andy Gilfillan7,69734.7−9.7
Labor Leon Bignell 7,68834.7+1.7
SA-BEST Hazel Wainwright4,14218.7+18.7
Greens Ami-Louise Harrison1,7898.1−3.4
Conservatives Heidi Greaves8673.9−4.7
Total formal votes22,18396.7−0.4
Informal votes7603.3+0.4
Turnout 22,94391.6+3.8
Two-party-preferred result
Labor Leon Bignell 11,14950.3+4.5
Liberal Andy Gilfillan11,03449.7−4.5
Labor gain from Liberal Swing +4.5

Morialta

South Australian state election, 2018: Morialta [34]
PartyCandidateVotes%±
Liberal John Gardner 10,33244.3−11.2
Labor Peter Field5,14622.1−5.6
SA-BEST James Sadler4,64519.9+19.9
Greens Simon Roberts-Thomson1,5256.5−4.3
Conservatives Matt Smith8543.7−2.3
Dignity Tim Farrow5602.4+2.4
Independent Peter Smythe2401.0+1.0
Total formal votes23,30295.9−1.3
Informal votes1,0074.1+1.3
Turnout 24,30993.5−0.2
Two-party-preferred result
Liberal John Gardner 14,15160.7−1.5
Labor Peter Field9,15139.3+1.5
Liberal hold Swing −1.5

Morphett

South Australian state election, 2018: Morphett [35]
PartyCandidateVotes%±
Liberal Stephen Patterson 9,57641.4−11.1
Labor Mark Siebentritt5,92925.6−7.1
Independent Duncan McFetridge 3,28814.2+14.2
SA-BEST Simon Jones2,79012.1+12.1
Greens Chris Crabbe1,1875.1−4.9
Dignity Monica Kwan3791.6+1.0
Total formal votes23,14996.7−0.2
Informal votes7853.3+0.2
Turnout 23,93490.7+2.4
Two-party-preferred result
Liberal Stephen Patterson 13,99860.5+2.6
Labor Mark Siebentritt9,15139.5−2.6
Liberal hold Swing +2.6

Mount Gambier

South Australian state election, 2018: Mount Gambier [36]
PartyCandidateVotes%±
Independent Troy Bell 8,31438.7+38.7
Liberal Craig Marsh5,16324.0−27.7
SA-BEST Kate Amoroso3,38515.8+15.8
Labor Isabel Scriven2,1189.9−1.0
Independent Richard Sage1,2505.8+5.8
Greens Gavin Clarke6653.1−1.7
Conservatives Gregg Bisset4642.2−2.9
Dignity Lance Jones1210.6+0.6
Total formal votes21,48094.4−2.8
Informal votes1,2665.6+2.8
Turnout 22,74691.8+2.5
Two-party-preferred result
Liberal Craig Marsh14,70568.5−2.9
Labor Isabel Scriven6,77531.5+2.9
Two-candidate-preferred result
Independent Troy Bell 12,94660.3+60.3
Liberal Craig Marsh8,53439.7−31.7
Independent gain from Liberal Swing N/A

Narungga

South Australian state election, 2018: Narungga [37]
PartyCandidateVotes%±
Liberal Fraser Ellis 10,26946.5−7.0
SA-BEST Sam Davies5,37824.3+24.3
Labor Douglas Milera3,73416.9−9.6
Conservatives Rebecca Hewett2,0129.1+1.9
Greens Jason Swales7003.2+0.3
Total formal votes22,09395.9−0.5
Informal votes9374.1+0.5
Turnout 23,03093.6+0.5
Two-party-preferred result
Liberal Fraser Ellis 14,88367.4+3.3
Labor Douglas Milera7,21032.6−3.3
Two-candidate-preferred result
Liberal Fraser Ellis 13,13659.5−4.6
SA-BEST Sam Davies8,95740.5+40.5
Liberal hold Swing N/A

Newland

South Australian state election, 2018: Newland [38]
PartyCandidateVotes%±
Liberal Richard Harvey 8,37636.6−6.6
Labor Tom Kenyon 7,77034.0−7.1
SA-BEST Rajini Vasan3,73016.3+16.3
Greens Stephanie Stewart1,2745.6−2.0
Conservatives Martin Leedham1,0114.4−3.8
Dignity Sandra Williams3661.6+1.6
Independent Shane Bailey3541.5+1.5
Total formal votes22,88195.6−1.5
Informal votes1,0504.4+1.5
Turnout 23,93192.4+1.0
Two-party-preferred result
Liberal Richard Harvey 11,88852.0+1.8
Labor Tom Kenyon 10,99348.0−1.8
Liberal hold Swing +1.8

Playford

South Australian state election, 2018: Playford [39]
PartyCandidateVotes%±
Labor Michael Brown 10,55147.2−4.9
Liberal Hemant Dave4,67920.9−10.4
SA-BEST Helen Szuty 4,45519.9+19.9
Greens Brock Le Cerf1,3466.0−1.1
Conservatives Shane Sheoran1,3255.9−3.5
Total formal votes22,35695.0−1.0
Informal votes1,1755.0+1.0
Turnout 23,53189.2+2.8
Two-party-preferred result
Labor Michael Brown 14,82766.3+4.6
Liberal Hemant Dave7,52933.7−4.6
Labor hold Swing +4.6

Port Adelaide

South Australian state election, 2018: Port Adelaide [40]
PartyCandidateVotes%±
Labor Susan Close 11,39647.9−3.1
Liberal Chad McLaren4,43218.6−9.2
SA-BEST Gary Johanson4,41918.6+18.6
Greens Danica Moors1,4005.9−4.0
Animal Justice Nicholas Hancock9303.9+3.9
Dignity Bryan Tingey5682.4+2.4
Conservatives Bruce Hambour4952.1−3.7
DanigPeter Matthews1630.7+0.7
Total formal votes23,80394.2−2.2
Informal votes1,4625.8+2.2
Turnout 25,26590.6+5.1
Two-party-preferred result
Labor Susan Close 15,89566.8+2.8
Liberal Chad McLaren7,90833.2−2.8
Two-candidate-preferred result
Labor Susan Close 14,55061.1−2.9
SA-BEST Gary Johanson9,25338.9+38.9
Labor hold Swing N/A

Ramsay

South Australian state election, 2018: Ramsay [41]
PartyCandidateVotes%±
Labor Zoe Bettison 11,05549.6−6.0
SA-BEST Tarnia George4,09018.3+18.3
Liberal Nick Charles3,60516.2−9.3
Independent Mark Aldridge1,5396.9+6.9
Greens Brett Ferris1,0824.9−2.6
Conservatives Domenico Ialeggio9364.2−7.3
Total formal votes22,30793.6−1.8
Informal votes1,5286.4+1.8
Turnout 23,83588.9+3.3
Two-party-preferred result
Labor Zoe Bettison 15,37468.9+1.2
Liberal Nick Charles6,93331.1−1.2
Two-candidate-preferred result
Labor Zoe Bettison 14,60065.5−2.3
SA-BEST Tarnia George7,70734.5+34.5
Labor hold Swing N/A

Reynell

South Australian state election, 2018: Reynell [42]
PartyCandidateVotes%±
Labor Katrine Hildyard 9,78447.0−2.1
Liberal Laura Curran4,45221.4−8.1
SA-BEST Joanne Mausolf3,67917.7+17.7
Greens Daniel Jury1,3576.5−2.3
Conservatives David Sires8604.1−5.0
Dignity Anna Tree6823.3+3.3
Total formal votes20,81494.2−1.5
Informal votes1,2815.8+1.5
Turnout 22,09589.0+2.7
Two-party-preferred result
Labor Katrine Hildyard 13,42764.5+3.4
Liberal Laura Curran7,38735.5−3.4
Labor hold Swing +3.4

Schubert

South Australian state election, 2018: Schubert [43]
PartyCandidateVotes%±
Liberal Stephan Knoll 11,20347.9−4.4
Labor David Haebich5,19922.2−4.4
SA-BEST Paul Brown4,57719.6+19.6
Greens Dave Irving1,2225.2−4.2
Conservatives Rikki Lambert1,1835.1−6.5
Total formal votes23,38496.4−0.7
Informal votes8793.6+0.7
Turnout 24,26394.3+3.5
Two-party-preferred result
Liberal Stephan Knoll 15,04264.3+2.0
Labor David Haebich8,34235.7−2.0
Liberal hold Swing +2.0

Stuart

South Australian state election, 2018: Stuart [44]
PartyCandidateVotes%±
Liberal Dan van Holst Pellekaan 14,15769.7+5.5
Labor Khatija Thomas4,69823.1+0.0
Greens Brendan Fitzgerald1,4607.2+2.4
Total formal votes20,31596.9−0.6
Informal votes6463.1+0.6
Turnout 20,96189.5−2.1
Two-party-preferred result
Liberal Dan van Holst Pellekaan 14,84773.1+3.0
Labor Khatija Thomas5,46826.9−3.0
Liberal hold Swing +3.0

Taylor

South Australian state election, 2018: Taylor [45]
PartyCandidateVotes%±
Labor Jon Gee 9,78643.6−4.3
SA-BEST Sonja Taylor5,64425.1+25.1
Liberal Sarika Sharma4,30819.2−13.0
Greens Kate Randell1,4916.6−0.5
Conservatives Danny Bradley1,2395.5−6.4
Total formal votes22,46894.3−1.4
Informal votes1,3585.7+1.4
Turnout 23,82686.7+4.6
Two-party-preferred result
Labor Jon Gee 13,66060.8+2.3
Liberal Sarika Sharma8,80839.2−2.3
Two-candidate-preferred result
Labor Jon Gee 12,51655.7−2.8
SA-BEST Sonja Taylor9,95244.3+44.3
Labor hold Swing N/A

Torrens

South Australian state election, 2018: Torrens [46]
PartyCandidateVotes%±
Labor Dana Wortley 9,98145.9+3.3
Liberal Therese Kenny8,81740.5−0.4
Greens Alex Dinovitser1,6687.7−1.7
Dignity John Duthie1,2895.9+5.5
Total formal votes21,75595.8−0.8
Informal votes9464.2+0.8
Turnout 22,70190.4+2.8
Two-party-preferred result
Labor Dana Wortley 11,87254.6+2.1
Liberal Therese Kenny9,88345.4−2.1
Labor hold Swing +2.1

Unley

South Australian state election, 2018: Unley [47]
PartyCandidateVotes%±
Liberal David Pisoni 12,10351.7−3.3
Labor Geoff Phillips5,38223.0−6.7
SA-BEST Anthony Olivier2,87812.3+12.3
Greens John Wishart2,2229.5−2.0
Dignity Anne Watkins5582.4−1.3
Total formal votes23,42797.5−0.6
Informal votes5932.5+0.6
Turnout 24,02091.6+2.0
Two-party-preferred result
Liberal David Pisoni 14,35561.3+2.4
Labor Geoff Phillips9,07238.7−2.4
Liberal hold Swing +2.4

Waite

South Australian state election, 2018: Waite [48]
PartyCandidateVotes%±
Liberal Sam Duluk 11,11545.2−8.0
Labor Cathy Hutchesson5,78323.5−2.6
SA-BEST Graham Davies3,87015.7+15.7
Greens Brendan White2,60710.6−5.0
Conservatives John Duncan6772.8−1.0
Dignity Cathi Tucker5332.2+0.9
Total formal votes24,58597.6−0.3
Informal votes5962.4+0.3
Turnout 25,18192.7+2.3
Two-party-preferred result
Liberal Sam Duluk 14,21157.8−2.3
Labor Cathy Hutchesson10,37442.2+2.3
Liberal hold Swing −2.3

West Torrens

South Australian state election, 2018: West Torrens [49]
PartyCandidateVotes%±
Labor Tom Koutsantonis 11,14750.3−0.3
Liberal Helika Cruz7,08232.0−1.5
Greens Livio Forza2,56311.6−0.1
Dignity Phillip Beddall1,1005.0+5.0
DanigJosh Dimas2701.2+1.2
Total formal votes22,16295.5−1.2
Informal votes1,0374.5+1.2
Turnout 23,19990.0+3.7
Two-party-preferred result
Labor Tom Koutsantonis 14,01063.2+0.9
Liberal Helika Cruz8,15236.8−0.9
Labor hold Swing +0.9

Wright

South Australian state election, 2018: Wright [50]
PartyCandidateVotes%±
Labor Blair Boyer 9,44939.6−5.1
Liberal Luigi Mesisca7,40731.0−7.1
SA-BEST Natasha Henningsen4,43718.6+18.6
Greens Jennifer Harness1,4125.9−1.2
Conservatives Eric Dennis1,1534.8−3.6
Total formal votes23,85895.9−0.3
Informal votes1,0244.1+0.3
Turnout 24,88292.2+4.0
Two-party-preferred result
Labor Blair Boyer 12,76753.5−0.8
Liberal Luigi Mesisca11,09146.5+0.8
Labor hold Swing −0.8

See also

This is a list of members of the South Australian House of Assembly from 2018 to 2022, as elected at the 2018 state election and subsequent by-elections.

Related Research Articles

Electoral district of Enfield state electoral district of South Australia

Enfield is a single-member electoral district for the South Australian House of Assembly. Named after the suburb of the same name, it is a 16.48 km2 (6.36 sq mi) suburban electorate in Adelaide's inner north, taking in the suburbs of Blair Athol, Broadview, Clearview, Enfield, Kilburn, Lightsview, Northgate, and Sefton Park; and parts of Nailsworth, Northfield and Prospect. The seat is currently vacant pending a by-election in February 2019—Labor MP John Rau resigned from parliament in December 2018, following Labor's defeat at the 2018 South Australian state election in March.

Electoral district of Adelaide South Australian state electoral district

Adelaide is a single-member electoral district for the South Australian House of Assembly. The 22.8 km² state seat of Adelaide currently consists of the Adelaide city centre including North Adelaide and suburbs to the inner north and inner north east: Collinswood, Fitzroy, Gilberton, Medindie, Medindie Gardens, Ovingham, Thorngate, Walkerville, most of Prospect, and part of Nailsworth. The federal division of Adelaide covers the state seat of Adelaide and additional suburbs in each direction.

Electoral district of Ashford state electoral district of South Australia

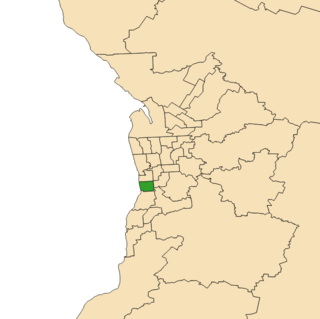
Ashford is a former electorate for the South Australian Legislative Assembly which included many of Adelaide's inner south western suburbs. The district formed part of three federal electorates: the Division of Hindmarsh, the Division of Boothby, and the Division of Adelaide. The former electorate included the suburbs of Ashford, Black Forest, Camden Park, Clarence Gardens, Clarence Park, Cumberland Park, Everard Park, Forestville, Glandore, Keswick, Kings Park, Novar Gardens and Plympton as well as parts of Edwardstown, Goodwood, Millswood, Plympton Park, South Plympton and Wayville. The former electorate covered an area of approximately 14.6 square kilometres (5.6 sq mi).

Electoral district of Schubert state electoral district of South Australia

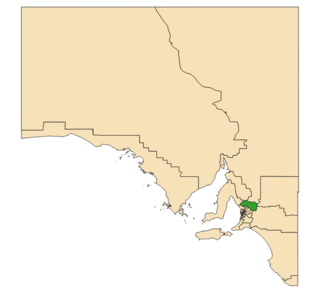
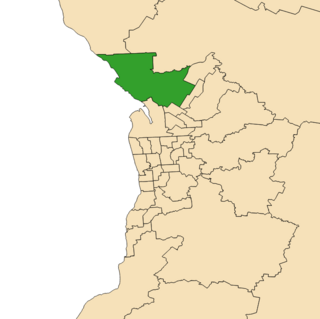
Schubert is a single-member electoral district for the South Australian House of Assembly covering an area of 2,017.8 km². It is named after Max Schubert, the winemaker of Penfolds Grange Hermitage. The Barossa Valley area was first represented by the seat of Barossa. The seat of Custance was abolished and recreated as Schubert in the 1994 redistribution and first contested at the 1997 election. Schubert currently covers the Barossa Valley area, the northern parts of the Adelaide Hills and much of the inner north and northwest plains bordering Adelaide. Areas covered include Eden Valley, Kangaroo Flat, Nuriootpa, Lyndoch, Springton, Tanunda, Wasleys and Williamstown.

Electoral district of Cheltenham state electoral district of South Australia

Cheltenham is a single-member electoral district for the South Australian House of Assembly. Named after the suburb of the same name, it is a 17.5 km² suburban electorate in Adelaide's north-west, taking in the suburbs of Albert Park, Alberton, Beverley, Cheltenham, Findon, Hendon, Pennington, Queenstown, St Clair, Woodville, Woodville North, Woodville Park, Woodville South, Woodville West, and part of Rosewater. The Cheltenham electorate is inside the federal-level electorate of Port Adelaide.

Electoral district of Croydon (South Australia) state electoral district of South Australia

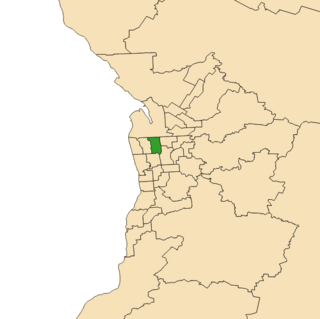
Croydon is a single-member electoral district for the South Australian House of Assembly. Named after the suburb of Croydon, it is a 18.78 km2 (7.25 sq mi) suburban electorate in Adelaide's inner north-west. In addition to Croydon, it includes Angle Park, Athol Park, Bowden, Brompton, Croydon Park, Devon Park, Dudley Park, Ferryden Park, Kilkenny, Mansfield Park, Regency Park, Renown Park, Ridleyton, West Croydon, Woodville Gardens; and parts of Allenby Gardens, Welland, and West Hindmarsh.

Electoral district of Kaurna state electoral district of South Australia

Kaurna is a single-member electoral district for the South Australian House of Assembly. Named after the Kaurna aboriginal tribe which originally inhabited the Adelaide plains, it is a 44.7 km² semi-urban electorate on Adelaide's far-southern beaches, taking in the suburbs of Hackham, Huntfield Heights, Maslin Beach, Moana, Noarlunga Downs, Old Noarlunga, Port Noarlunga South, Seaford, Seaford Heights, Seaford Meadows and Seaford Rise, as well as part of Onkaparinga Hills. It is one of only two state districts named after South Australia's indigenous people.

Electoral district of Morialta state electoral district of South Australia

Morialta is a single-member electoral district for the South Australian House of Assembly. It is a 356 km2 electorate stretching from the Adelaide Hills to the outer eastern and north-eastern suburbs of Adelaide, taking in the suburbs and localities of Ashton, Athelstone, Basket Range, Birdwood, Castambul, Cherryville, Cudlee Creek, Forest Range, Gumeracha, Highbury, Kenton Valley, Lenswood, Lobethal, Marble Hill, Montacute, Mount Torrens, Norton Summit, Rostrevor, Summertown, Teringie, Uraidla and Woodforde, as well as part of Chain of Ponds.

Electoral district of Waite South Australian state electoral district

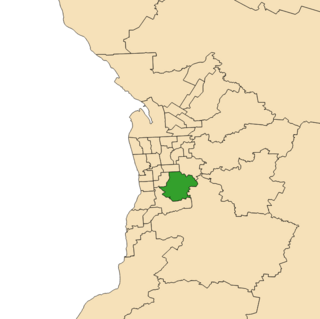
Waite is a single-member electoral district for the South Australian House of Assembly. Named after Peter Waite, a 19th century entrepreneur and philanthropist, it covers 75.4 km² of suburbs and foothills in Adelaide's inner south-east, taking in the suburbs of Belair, Blackwood, Brown Hill Creek, Coromandel East, Coromandel Valley, Crafers West, Craigburn Farm, Eden Hills, Glenalta, Hawthorndene, Kingswood, Lynton, Mitcham, Netherby, Springfield, Torrens Park, Urrbrae as well as part of Upper Sturt.

Electoral district of West Torrens state electoral district of South Australia

West Torrens is a single-member electoral district for the South Australian House of Assembly. Named after the City of West Torrens, it is a 25.1 km² suburban electorate in Adelaide's west. It includes the suburbs and areas of Brooklyn Park, Cowandilla, Flinders Park, Hilton, Hindmarsh, Keswick Terminal, Marleston, Mile End, Mile End South, Netley, Richmond, Thebarton, Torrensville, Underdale and West Richmond, as well as parts of Allenby Gardens, Lockleys, Welland and West Hindmarsh.

Electoral district of Torrens state electoral district of South Australia

Torrens is a single-member electoral district for the South Australian House of Assembly. Located along the River Torrens, it is named after Robert Torrens, a 19th-century Premier of South Australia, and also the founder of the "Torrens title" land registration system. Torrens is an 18.8 km² suburban electorate in Adelaide's north-east. It includes the suburbs of Dernancourt, Gilles Plains, Greenacres, Hampstead Gardens, Hillcrest, Holden Hill, Klemzig, Manningham, Oakden, Vale Park and Windsor Gardens.

Electoral district of Taylor state electoral district of South Australia

Taylor is a single-member electoral district for the South Australian House of Assembly. This district is named after Doris Irene Taylor MBE, a leading force in the founding of Meals on Wheels, and Labor activist. Taylor is a 318.7 km² semi-urban electorate in Adelaide's far northern suburbs and fringe farmland. A large portion of the district lives in its southern edges, corresponding to the northern fringes of Adelaide. It includes the suburbs, towns and localities of Andrews Farm, Angle Vale, Buckland Park, Burton, Davoren Park, Direk, Edinburgh, Edinburgh North, Elizabeth North, Macdonald Park, Middle Beach, Penfield, Penfield Gardens, Port Gawler, Smithfield, Smithfield Plains, Two Wells, Virginia, and Waterloo Corner.

Electoral district of Reynell state electoral district of South Australia

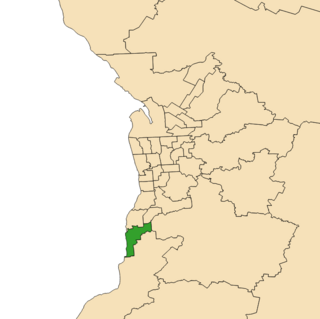
Reynell is a single-member electoral district for the South Australian House of Assembly. It is named after John Reynell, a founder of the Agricultural and Horticultural Society of South Australia and noted 19th-century wheat farmer, sheep and cattle breeder, vigneron and winemaker in the area. Reynell is a 33.1 km² urban residential and industrial electorate in Adelaide's far south. It includes the suburbs of Christies Beach, Christie Downs, Hackham West, Lonsdale, Noarlunga Centre, O'Sullivan Beach, Port Noarlunga and Reynella, as well as part of Morphett Vale.

Electoral district of Port Adelaide state electoral district of South Australia

Port Adelaide is a single-member electoral district for the South Australian House of Assembly. Named after Port Adelaide, which it surrounds, it is a 118.8 km² suburban and industrial electorate on Adelaide's Lefevre Peninsula, and stretches east toward Adelaide's northern suburbs. It contains a mix of seaside residential areas, wasteland and industrial regions. In addition to its namesake suburb of Port Adelaide, the district includes the suburbs of Birkenhead, Bolivar, Cavan, Dry Creek, Ethelton, Exeter, Garden Island, Gepps Cross, Gillman, Glanville, Globe Derby Park, Largs Bay, Largs North, New Port, North Haven, Osborne, Ottoway, Outer Harbor, Peterhead, Semaphore, Semaphore South, St Kilda, Taperoo, Torrens Island, Wingfield, as well as part of Rosewater.

This is a list of members of the South Australian House of Assembly from 1906 to 1910, as elected at the 1906 state election:

This is a list of members of the South Australian House of Assembly from 1899 to 1902, as elected at the 1899 colonial election:

This is a list of members of the South Australian House of Assembly from 1893 to 1896, as elected at the 1893 colonial election:

Electoral district of Gibson state electoral district of South Australia

Gibson is a single-member electoral district for the South Australian House of Assembly. It was created by the redistribution conducted in 2016, and was contested for the first time at the 2018 state election.

Electoral district of Badcoe state electoral district of South Australia

Badcoe is a single-member electoral district for the South Australian House of Assembly. It was created by the redistribution conducted in 2016, and was contested for the first time at the 2018 state election.

References

  1. "House of Assembly State Summary". Electoral Commission of South Australia . Government of South Australia. March 2018. Retrieved 17 March 2018.
  2. 2018 SA election results: Antony Green ABC
  3. "Notional two-party preferred results". ECSA. Retrieved 4 April 2018.
  4. State Election Results - District Results for Adelaide, ECSA.
  5. State Election Results - District Results for Badcoe, ECSA.
  6. State Election Results - District Results for Black, ECSA.
  7. State Election Results - District Results for Bragg, ECSA.
  8. State Election Results - District Results for Chaffey, ECSA.
  9. State Election Results - District Results for Cheltenham, ECSA.
  10. State Election Results - District Results for Colton, ECSA.
  11. State Election Results - District Results for Croydon, ECSA.
  12. State Election Results - District Results for Davenport, ECSA.
  13. State Election Results - District Results for Dunstan, ECSA.
  14. State Election Results - District Results for Elder, ECSA.
  15. State Election Results - District Results for Elizabeth, ECSA.
  16. State Election Results - District Results for Enfield, ECSA.
  17. State Election Results - District Results for Finniss, ECSA.
  18. State Election Results - District Results for Flinders, ECSA.
  19. State Election Results - District Results for Florey, ECSA.
  20. State Election Results - District Results for Frome, ECSA.
  21. State Election Results - District Results for Gibson, ECSA.
  22. State Election Results - District Results for Giles, ECSA.
  23. State Election Results - District Results for Hammond, ECSA.
  24. State Election Results - District Results for Hartley, ECSA.
  25. State Election Results - District Results for Heysen, ECSA.
  26. State Election Results - District Results for Hurtle Vale, ECSA.
  27. State Election Results - District Results for Kaurna, ECSA.
  28. State Election Results - District Results for Kavel, ECSA.
  29. State Election Results - District Results for King, ECSA.
  30. State Election Results - District Results for Lee, ECSA.
  31. State Election Results - District Results for Light, ECSA.
  32. State Election Results - District Results for MacKillop, ECSA.
  33. State Election Results - District Results for Mawson, ECSA.
  34. State Election Results - District Results for Morialta, ECSA.
  35. State Election Results - District Results for Morphett, ECSA.
  36. State Election Results - District Results for Mount Gambier, ECSA.
  37. State Election Results - District Results for Narungga, ECSA.
  38. State Election Results - District Results for Newland, ECSA.
  39. State Election Results - District Results for Playford, ECSA.
  40. State Election Results - District Results for Port Adelaide, ECSA.
  41. State Election Results - District Results for Ramsay, ECSA.
  42. State Election Results - District Results for Reynell, ECSA.
  43. State Election Results - District Results for Schubert, ECSA.
  44. State Election Results - District Results for Stuart, ECSA.
  45. State Election Results - District Results for Taylor, ECSA.
  46. State Election Results - District Results for Torrens, ECSA.
  47. State Election Results - District Results for Unley, ECSA.
  48. State Election Results - District Results for Waite, ECSA.
  49. State Election Results - District Results for West Torrens, ECSA.
  50. State Election Results - District Results for Wright, ECSA.