Rosario, Northern Samar

Last updated
Rosario
Municipality of Rosario
Flag of Rosario, Northern Samar.png
Ph locator northern samar rosario.png
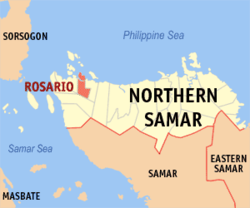
Map of Northern Samar with Rosario highlighted
OpenStreetMap
Rosario, Northern Samar
Philippines location map (square).svg
Red pog.svg
Rosario
Location within the Philippines
Coordinates: 12°31′N124°25′E / 12.52°N 124.42°E / 12.52; 124.42
Country Philippines
Region Eastern Visayas
Province Northern Samar
District 1st district
Barangays 11 (see Barangays)
Government
[1]
  Type Sangguniang Bayan
   Mayor David A. Bido
   Vice Mayor Vicente B. Arillo Jr.
   Representative Paul R. Daza
  Councilors
List
   Electorate 9,361 voters (2025)
Area
[2]
  Total
31.60 km2 (12.20 sq mi)
Elevation
35 m (115 ft)
Highest elevation
271 m (889 ft)
Lowest elevation
−2 m (−7 ft)
Population
 (2024 census) [3]
  Total
11,726
  Density370/km2 (960/sq mi)
   Households
2,438
Economy
   Income class 5th municipal income class
   Poverty incidence
26.27
% (2021) [4]
   Revenue 84.9 million (2022)
   Assets 259.6 million (2022)
   Expenditure 64.94 million (2022)
   Liabilities 85.9 million (2022)
Service provider
  ElectricityNorthern Samar Electric Cooperative (NORSAMELCO)
Time zone UTC+8 (PST)
ZIP code
6416
PSGC
IDD : area code +63(0)55
Native languages Waray
Tagalog

Rosario, officially the Municipality of Rosario (Waray : Bungto han Rosario; Tagalog : Bayan ng Rosario), is a municipality in the province of Northern Samar, Philippines. According to the 2020 census, it has a population of 10,949 people. [5]

Contents

It is bordered in the west by Lavezares and Victoria to the south. Its coastal area is protected as part of the Biri Larosa Protected Landscape and Seascape.

Geography

Barangays

Rosario is politically subdivided into 11 barangays. Each barangay consists of puroks and some have sitios.

Climate

Climate data for Rosario, Northern Samar
MonthJanFebMarAprMayJunJulAugSepOctNovDecYear
Mean daily maximum °C (°F)27
(81)
28
(82)
29
(84)
30
(86)
31
(88)
30
(86)
29
(84)
29
(84)
29
(84)
29
(84)
29
(84)
28
(82)
29
(84)
Mean daily minimum °C (°F)22
(72)
22
(72)
22
(72)
22
(72)
24
(75)
24
(75)
24
(75)
24
(75)
24
(75)
24
(75)
23
(73)
23
(73)
23
(74)
Average precipitation mm (inches)84
(3.3)
59
(2.3)
58
(2.3)
55
(2.2)
93
(3.7)
133
(5.2)
149
(5.9)
125
(4.9)
155
(6.1)
165
(6.5)
140
(5.5)
136
(5.4)
1,352
(53.3)
Average rainy days18.113.615.816.121.725.526.625.124.825.822.720.1255.9
Source: Meteoblue [6]

Demographics

Population census of Rosario
YearPop.±% p.a.
1970 3,782    
1975 5,176+6.50%
1980 5,872+2.55%
1990 6,699+1.33%
1995 8,626+4.85%
2000 8,647+0.05%
2007 8,920+0.43%
2010 10,214+5.05%
2015 10,520+0.56%
2020 10,949+0.84%
2024 11,726+1.66%
Source: Philippine Statistics Authority [7] [8] [9] [10] [11]

Economy

Poverty incidence of Rosario

10
20
30
40
50
60
2000
50.35
2003
38.80
2006
39.30
2009
41.56
2012
43.46
2015
45.18
2018
32.98
2021
26.27

Source: Philippine Statistics Authority [12] [13] [14] [15] [16] [17] [18] [19]

References

  1. Municipality of Rosario | (DILG)
  2. "2015 Census of Population, Report No. 3 – Population, Land Area, and Population Density" (PDF). Philippine Statistics Authority. Quezon City, Philippines. August 2016. ISSN   0117-1453. Archived (PDF) from the original on May 25, 2021. Retrieved July 16, 2021.
  3. "2024 Census of Population (POPCEN) Population Counts Declared Official by the President". Philippine Statistics Authority. 17 July 2025. Retrieved 18 July 2025.
  4. "PSA Releases the 2021 City and Municipal Level Poverty Estimates". Philippine Statistics Authority. 2 April 2024. Retrieved 28 April 2024.
  5. "2024 Census of Population (POPCEN) Population Counts Declared Official by the President". Philippine Statistics Authority. 17 July 2025. Retrieved 18 July 2025.
  6. "Rosario, Northern Samar : Average Temperatures and Rainfall". Meteoblue. Retrieved 6 January 2019.
  7. "2024 Census of Population (POPCEN) Population Counts Declared Official by the President". Philippine Statistics Authority. 17 July 2025. Retrieved 18 July 2025.
  8. Census of Population (2015). "Region VIII (Eastern Visayas)". Total Population by Province, City, Municipality and Barangay. Philippine Statistics Authority . Retrieved 20 June 2016.
  9. Census of Population and Housing (2010). "Region VIII (Eastern Visayas)" (PDF). Total Population by Province, City, Municipality and Barangay. National Statistics Office . Retrieved 29 June 2016.
  10. Censuses of Population (1903–2007). "Region VIII (Eastern Visayas)". Table 1. Population Enumerated in Various Censuses by Province/Highly Urbanized City: 1903 to 2007. National Statistics Office.
  11. "Province of". Municipality Population Data. Local Water Utilities Administration Research Division. Retrieved 17 December 2016.
  12. "Poverty incidence (PI):". Philippine Statistics Authority. Retrieved December 28, 2020.
  13. "Estimation of Local Poverty in the Philippines" (PDF). Philippine Statistics Authority. 29 November 2005.
  14. "2003 City and Municipal Level Poverty Estimates" (PDF). Philippine Statistics Authority. 23 March 2009.
  15. "City and Municipal Level Poverty Estimates; 2006 and 2009" (PDF). Philippine Statistics Authority. 3 August 2012.
  16. "2012 Municipal and City Level Poverty Estimates" (PDF). Philippine Statistics Authority. 31 May 2016.
  17. "Municipal and City Level Small Area Poverty Estimates; 2009, 2012 and 2015". Philippine Statistics Authority. 10 July 2019.
  18. "PSA Releases the 2018 Municipal and City Level Poverty Estimates". Philippine Statistics Authority. 15 December 2021. Retrieved 22 January 2022.
  19. "PSA Releases the 2021 City and Municipal Level Poverty Estimates". Philippine Statistics Authority. 2 April 2024. Retrieved 28 April 2024.