South Surrey—White Rock—Cloverdale

Last updated • a couple of secsFrom Wikipedia, The Free Encyclopedia

South Surrey—White Rock—Cloverdale
Flag of British Columbia.svg British Columbia electoral district
South Surrey--White Rock--Cloverdale.png
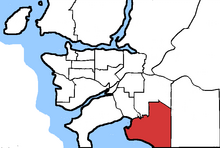
South Surrey—White Rock—Cloverdale in relation to other federal electoral districts in Vancouver
Defunct federal electoral district
Legislature House of Commons
District created2003
District abolished2013
First contested 2004
Last contested 2011
District webpage profile, map
Demographics
Population (2011) [1] 127,729
Electors (2011)84,964
Area (km²) [2] 149.69
Census division(s) Greater Vancouver
Census subdivision(s) Surrey, White Rock

South Surrey—White Rock—Cloverdale was a federal electoral district in British Columbia, Canada, that was represented in the House of Commons of Canada from 2004 until the 2015 election.

Contents

History

This electoral district was created in 2003 from parts of South Surrey—White Rock—Langley and Surrey Central ridings. This riding was dissolved into South Surrey—White Rock and Cloverdale—Langley City during the 2012 electoral redistribution.

Member of Parliament

ParliamentYearsMemberParty
South Surrey—White Rock—Cloverdale
Riding created from South Surrey—White Rock—Langley
and Surrey Central
38th  2004–2006   Russ Hiebert Conservative
39th  2006–2008
40th  2008–2011
41st  2011–2015
Riding dissolved into South Surrey—White Rock
and Cloverdale—Langley City

Election results

2011 Canadian federal election
PartyCandidateVotes%±%Expenditures
Conservative Russ Hiebert 31,99054.55-2.10$85,919.55
New Democratic Susan Keeping11,88120.26+7.29$22,074.76
Liberal Hardy Staub9,77516.67-4.23$54,084.72
Green Larry Colero3,2455.53-3.45$9,994.22
Independent Aart Looye7531.28$5,291.01
Christian Heritage Mike Schouten4290.73$25,726.58
Progressive Canadian Brian Marlatt2280.39-0.11$387.20
Independent David Hawkins1890.32$187.76
Independent Kevin Peter Donohoe1520.26
Total valid votes/expense limit58,64299.73  $94,502.05
Total rejected ballots158 0.27-0.08
Turnout58,800 64.27-0.81
Eligible voters 91,485
Conservative hold Swing -4.70
2008 Canadian federal election
PartyCandidateVotes%±%Expenditures
Conservative Russ Hiebert 31,21656.65+9.97$86,306
Liberal Judy Higginbotham11,51520.90-9.78$73,897
New Democratic Peter Prontzos7,14612.97-3.88$15,823
Green David Blair4,9518.99+3.71$2,003
Progressive Canadian Brian Marlatt2730.50-0.02$308
Total valid votes/expense limit55,10199.65 $88,340
Total rejected ballots1950.35+0.18
Turnout55,29665.08-4.71
Eligible voters 84,964
Conservative hold Swing +9.87
2006 Canadian federal election
PartyCandidateVotes%±%Expenditures
Conservative Russ Hiebert 26,38346.68+4.01$80,147
Liberal Jim McMurtry17,33630.67-6.09$49,292
New Democratic Libby Thornton9,52516.85+2.49$16,610
Green Pierre Rovtar2,9805.27-0.41$3,412
Progressive Canadian Brian Marlatt2930.52$750
Total valid votes56,51799.83
Total rejected ballots990.17-0.07
Turnout56,61669.79+0.36
Eligible voters 81,122
Conservative hold Swing +5.05
2004 Canadian federal election
PartyCandidateVotes%±%Expenditures
Conservative Russ Hiebert 22,76042.67-26.46$67,081
Liberal Judy Higginbotham19,61136.77+14.31$67,534
New Democratic Pummy Kaur7,66314.37+8.93$16,050
Green Romeo de la Pena3,0325.68$850
Canadian Action Pat Taylor2720.51
Total valid votes53,33899.75
Total rejected ballots1320.25
Turnout53,47069.43
Eligible voters 77,012
Conservative notional hold Swing -20.38
2000 federal election redistributed results [3]
PartyVote %
  Canadian Alliance 27,78858.73
  Liberal 10,62622.46
  Progressive Conservative 4,92010.40
  New Democratic 2,5715.43
 Others1,4072.97

See also

References

49°04′N122°46′W / 49.07°N 122.77°W / 49.07; -122.77