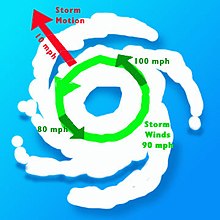
The Saffir–Simpson hurricane wind scale (SSHWS) classifies hurricanes—which in the Western Hemisphere are tropical cyclones that exceed the intensities of tropical depressions and tropical storms—into five categories distinguished by the intensities of their sustained winds. This measuring system was formerly known as the Saffir–Simpson hurricane scale, or SSHS.
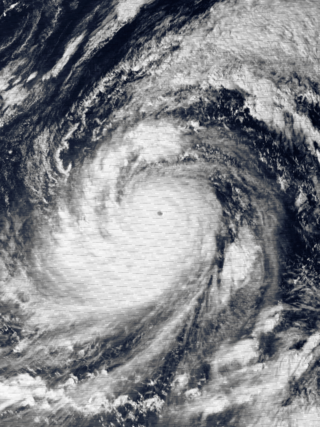
Typhoon Tip, known in the Philippines as Super Typhoon Warling, was the largest and most intense tropical cyclone ever recorded. The forty-third tropical depression, nineteenth tropical storm, twelfth typhoon, and third super typhoon of the 1979 Pacific typhoon season, Tip developed out of a disturbance within the monsoon trough on October 4 near Pohnpei in Micronesia. Initially, Tropical Storm Roger to the northwest hindered the development and motion of Tip, though after the storm tracked farther north, Tip was able to intensify. After passing Guam, Tip rapidly intensified and reached peak sustained winds of 305 km/h (190 mph) and a worldwide record-low sea-level pressure of 870 hPa (25.69 inHg) on October 12. At its peak intensity, Tip was the largest tropical cyclone on record, with a wind diameter of 2,220 km (1,380 mi). Tip slowly weakened as it continued west-northwestward and later turned to the northeast, in response to an approaching trough. The typhoon made landfall in southern Japan on October 19, and became an extratropical cyclone shortly thereafter. Tip's extratropical remnants continued moving east-northeastward, until they dissipated near the Aleutian Islands on October 24.

Tropical cyclones are ranked on one of five tropical cyclone intensity scales, according to their maximum sustained winds and which tropical cyclone basins they are located in. Only a few scales of classifications are used officially by the meteorological agencies monitoring the tropical cyclones, but other scales also exist, such as accumulated cyclone energy, the Power Dissipation Index, the Integrated Kinetic Energy Index, and the Hurricane Severity Index.

An Atlantic hurricane is a type of tropical cyclone that forms in the Atlantic Ocean primarily between June and November. The terms "hurricane", "typhoon", and "cyclone" can be used interchangeably to describe this weather phenomenon. These storms are rotating, organized systems of clouds and thunderstorms that originate over tropical or subtropical waters and have closed low-level circulation, not to be confused with tornadoes. They form over low pressure systems. In the North Atlantic, central North Pacific, and eastern North Pacific, the term "hurricane" is mainly used, whereas "typhoon" is more commonly used for storms originating in the western North Pacific. The term "cyclone" is used in the South Pacific and Indian Ocean.

Super Typhoon Nancy, also known as the 2nd Muroto Typhoon, was an extremely powerful tropical cyclone of the 1961 Pacific typhoon season and one of the most intense tropical cyclones on record. The system possibly had the strongest winds ever measured in a tropical cyclone, with 345 km/h (215 mph) winds, tied with Hurricane Patricia of 2015. Nancy caused extensive damage, as well as at least 202 deaths and nearly 5,000 injuries in Japan and elsewhere, in September 1961.

The September 1948 Florida hurricane(Air Weather Service designation: Easy) was the most intense tropical cyclone to make landfall in the state since the 1935 Labor Day hurricane. The fourth hurricane and third major hurricane of the season, this storm developed from a tropical wave over the Caribbean Sea on September 18. Early the next day, the system strengthened into a hurricane while moving westward passing close to Grand Cayman, Cayman Islands. Thereafter, it curved northwestward and continued to deepen. By September 20, the system turned northward and later that day made landfall in Zapata Peninsula, Cuba as a Category 3 hurricane on the modern day Saffir–Simpson hurricane wind scale. Another landfall occurred in Cuba early the next day to the south of Güines. Severe destruction was reported on the island, with winds up to 90 mph (140 km/h) observed in Havana. Over 700 buildings were destroyed. Ten deaths occurred and damage totaled at least $2 million (1948 USD), while other sources estimate "several million dollars."

Typhoon Rose, known in the Philippines as Typhoon Uring, was the most violent and intense tropical cyclone to strike Hong Kong since Typhoon Wanda in 1962. The 21st named storm of the 1971 Pacific typhoon season, Rose developed from an area of disturbed weather while west of Guam on August 9. Moving west-northwestward, the storm briefly became a typhoon on the following day. After weakening to a tropical storm on August 11, Rose re-intensified into a typhoon several hours later. The system then curved westward and reached a primary peak intensity with winds of 205 km/h (127 mph) on August 13. Later that day, the typhoon made landfall near Palanan, Isabela in the Philippines. Rose weakened significantly while crossing the island of Luzon and was a minimal typhoon upon reaching the South China Sea on August 14.

Hurricane Fox was a powerful and destructive tropical cyclone that crossed central Cuba in October 1952. The seventh named storm, sixth hurricane, and third major hurricane of the 1952 Atlantic hurricane season, it was the strongest and deadliest system of the season. Fox developed northwest of Cartagena, Colombia, in the southern Caribbean Sea. It moved steadily northwest, intensifying to a tropical storm on October 21. The next day, it rapidly strengthened into a hurricane and turned north passing closely to Grand Cayman, Cayman Islands. The cyclone attained peak winds of 145 mph (233 km/h) as it struck Cayo Guano del Este off the coast of Cienfuegos. Fox made landfall on Cuba at maximum intensity, producing peak gusts of 170–180 mph (270–290 km/h). It weakened over land, but it re-strengthened as it turned east over the Bahamas. On October 26, it weakened and took an erratic path, dissipating west-southwest of Bermuda on October 28.
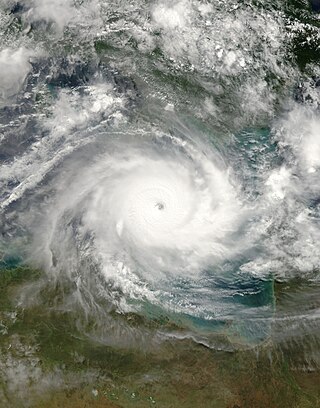
Severe Tropical Cyclone Monica was the most intense tropical cyclone, in terms of maximum sustained winds, on record to impact Australia. The 17th and final storm of the 2005–06 Australian region cyclone season, Monica originated from an area of low pressure off the coast of Papua New Guinea on 16 April 2006. The storm quickly developed into a Category 1 cyclone the next day, at which time it was given the name Monica. Travelling towards the west, the storm intensified into a severe tropical cyclone before making landfall in Far North Queensland, near Lockhart River, on 19 April 2006. After moving over land, convection associated with the storm quickly became disorganised.

Severe Tropical Cyclone Gwenda is tied with Cyclone Inigo as the most intense Australian tropical cyclone on record, with a barometric pressure of 900 hPa (mbar) and was the most intense storm worldwide in 1999. Forming out of a tropical disturbance over the Arafura Sea on 2 April 1999, the precursor to Gwenda tracked slowly westward and gradually became more organised. On 4 April, the system developed into a Category 1 cyclone and was named Gwenda. It began to undergo explosive intensification the following day, and in a 30-hour span ending early on 7 April, the storm's maximum 10-minute sustained wind speed increased from 75 to 225 km/h and its barometric pressure decreased to 900 hPa (mbar). The Joint Typhoon Warning Center reported that the storm had peaked as a high-end Category 4 equivalent on the Saffir–Simpson hurricane scale.
During 2005, tropical cyclones formed within seven different tropical cyclone basins, located within various parts of the Atlantic, Pacific and Indian Oceans. During the year, a total of 141 systems formed with 94 of these developing further and were named by the responsible warning centre. The strongest tropical cyclone of the year was Hurricane Wilma, which was estimated to have a minimum barometric pressure of 882 hPa (26.05 inHg). 2005 was above-average in terms of the number of storms. The most active basin in the year was the North Atlantic, which documented 28 named systems. The Western Pacific had an near-average season with 23 named storms. The Eastern Pacific hurricane season experienced an above-average number of tropical storm intensity systems, numbering 15. Activity across the southern hemisphere's three basins – South-West Indian, Australian, and South Pacific – was fairly significant, with the regions recording 23 named storms altogether, with the most intense Southern Hemisphere cyclone of the year, Cyclone Percy from the South Pacific Ocean basin peaking at 145 mph (235 km/h) and 900 millibars. Throughout the year, 28 Category 3 tropical cyclones formed, including eight Category 5 tropical cyclones in the year. The accumulated cyclone energy (ACE) index for the 2005, as calculated by Colorado State University was 899.6 units.

Throughout 2006, 133 tropical cyclones formed in seven bodies of water known as tropical cyclone basins. Of these, 80 have been named, including two tropical cyclones in the South Atlantic Ocean, and a tropical cyclone in the Mediterranean Sea, by various weather agencies when they attained maximum sustained winds of 65 km/h (40 mph). The strongest storms of the year were Typhoon Yagi in the Western Pacific, and Cyclone Glenda of the Australian region. The deadliest and costliest storms of the year were a series of five typhoons that struck the Philippines and China; Chanchu, Bilis, Saomai, Xangsane, and Durian, with most of the damage being caused by Durian of November. So far, 27 Category 3 tropical cyclones formed, including five Category 5 tropical cyclones in the year. The accumulated cyclone energy (ACE) index for the 2006, as calculated by Colorado State University was 761 units.
The following is a glossary of tropical cyclone terms.

Severe Tropical Cyclone Ernie was one of the quickest strengthening tropical cyclones on record. Ernie was the first Category 5 severe tropical cyclone in the Australian region since Cyclone Marcia in 2015, and also the strongest tropical cyclone in the Australian region since Cyclone Ita in 2014. Ernie developed from a tropical low into a cyclone south of Indonesia in the northeast Indian Ocean on 6 April 2017, and proceeded to intensify extremely rapidly to a Category 5 severe tropical cyclone. A few days later, on 10 April, the system was downgraded below cyclone intensity following a period of rapid weakening, located southwest of its original position. Ernie had no known impacts on any land areas.

During 2019, tropical cyclones formed within seven different tropical cyclone basins, located within various parts of the Atlantic, Pacific and Indian Oceans. During the year,a total of 142 systems formed, with 100 of these developing further and being named by the responsible warning centre. The strongest tropical cyclone of the year was Typhoon Halong, with a minimum barometric pressure of 905 hPa (26.72 inHg). Cyclone Idai became the deadliest tropical cyclone of the year, after killing at least 1,303 people in Mozambique, Malawi, Zimbabwe, and Madagascar. The costliest tropical cyclone of the year was Typhoon Hagibis, which caused more than $15 billion in damage after striking Japan.

2020 was regarded as the most active tropical cyclone year on record, documenting 104 named tropical systems. During the year, 141 tropical cyclones formed in bodies of water known as tropical cyclone basins. Of these, a record-high of 104, including three subtropical cyclones in the South Atlantic Ocean and three tropical-like cyclones in the Mediterranean, were named by various weather agencies when they attained maximum sustained winds of 35 knots. The strongest storm of the year was Typhoon Goni, peaking with a pressure of 905 hPa (26.72 inHg). The deadliest storm of the year was Hurricane Eta which caused 175 fatalities and another 100+ to be missing in Central America and the US, while the costliest storm of the year was Hurricane Laura, with a damage cost around $19.1 billion in the Greater Antilles, The Bahamas, and the Gulf Coast of the United States.

During 2004, tropical cyclones formed within seven different tropical cyclone basins, located within various parts of the Atlantic, Pacific and Indian Oceans. During the year, a total of 132 systems formed with 82 of these developing further and were named by the responsible warning centre. The strongest tropical cyclone of the year was Cyclone Gafilo, which was estimated to have a minimum barometric pressure of 895 hPa (26.43 inHg). The most active basin in the year was the Western Pacific, which documented 29 named systems, while the North Atlantic 15 named systems formed. Conversely, both the Eastern Pacific hurricane and North Indian Ocean cyclone seasons experienced a below average number of named systems, numbering 12 and 4, respectively. Activity across the southern hemisphere's three basins—South-West Indian, Australian, and South Pacific—was spread evenly, with each region recording seven named storms apiece. Throughout the year, 28 Category 3 tropical cyclones formed, including seven Category 5 tropical cyclones formed in the year. The accumulated cyclone energy (ACE) index for the 2004, as calculated by Colorado State University was 1024.4 units.

During 1995, tropical cyclones formed within seven different bodies of water called basins. To date, 110 tropical cyclones formed, of which 74 were given names by various weather agencies. The strongest storm and the deadliest storm of the year was Typhoon Angela, which reached a minimum central pressure of 910 hPa (26.87 inHg) and caused a total of 936 deaths throughout the Philippines. The costliest storm of the year was Hurricane Opal, which caused $4.7 billion in damage throughout Central America and the Gulf Coast of the United States. The accumulated cyclone energy (ACE) index for the 1995, as calculated by Colorado State University was 779.3 units.