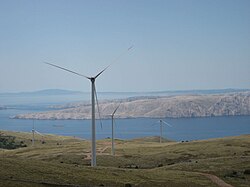
Wind power in Croatia has been growing since the first wind farm was installed in the country in 2004. [1] During 2021, the energy produced from wind farms amounted to 1,904 GWh. [2] The total wind power grid-connected capacity in Croatia was 1,143 MW as of 2023. [3]
The first wind farm was installed on the island of Pag in 2004. [1] In 2006 another farm opened near Šibenik. On July 1, 2007 the Croatian Government enacted five bylaws on incentives to electricity generation from renewable resources, including feed-in tariffs. [4]
Currently in Croatia there's a total of 364 wind turbines which generate total of 970.15 MW or electric energy, but with new turbines coming on-line all the time, it is expected that by mid 2020s total installed power will reach 3,200 MW, [5] As of early 2020 Croatia generates around 28.3% renewable energy, Government hopes Croatia could generate around 37.5% renewable energy from wind and solar by 2030 and has adopted new strategy to achieve that target. [6] By the end of 2021 renewable energy in Croatia is expected to generate around 1060 MW from Wind and Solar alone or around 32% of all energy consumption from renewable energy source, Croatia exceeded EU's renewable energy targets and exceed that by a wide margin. In 2020 country generated 28.3% of all its energy from the renewable sources of energy, installed capacity at the end of 2020 includes 89 MW Solar farms [7] and these are set to double in 2021 to 184 MW installed capacity, [8] 803.1 MW Wind farm are set to increase to at least 875 MW by end of 2021, and other sources such as biomass and other sources will exceed 2020 figure of total 3,226 MW installed renewable energy generation by significant margin. [9] [10] At present rate of growth and planned investments over next 5-7 year period, energy generated from Wind and solar should easily reach 40% of total energy consumption in Croatia with 50% highly probable, achieving targets set by Germany, Sweden, Norway, Denmark, Finland and Austria. Although Croatian Government has set modest targets in terms of renewable energy share of total energy consumption, initially 20% by 2020 and now modest 37.5% by 2030 or 54% by 2050, the country is rapidly approaching targets set for 2050, at current rate of expansion of renewable sources in Croatia, it is quite possible by 2035 Croatia will meet its 2050 targets, some 15 years ahead.
Wind farm | Production capacity (MW) | Annual production (GWh) | Wind turbines | Year of commissioning | Source |
---|---|---|---|---|---|
VE Senj | 156 | 530 | 39 x Shanghai Electric – 4.0 MW | 2021 | [11] |
VE Krš-Pađene | 142 | 480 | 48 x Nordex | 2021 | |
VE Korlat | 58 | 170 | 18 x Nordex – 3.2 MW | 2021 | [12] |
VE Lukovac | 48 | 110 | 7 x GE Energy – 2.85 MW 9 x GE Energy – 3.2 MW | 2017 | [13] |
VE Poštak | 44.2 | 100 | 13 × Siemens – 3.4 MW | 2017 | [14] |
VE Danilo | 43.7 | 100 | 19 × Enercon – 2.3 MW | 2014 | [15] |
VE Vrataruša | 42 | 125 | 14 × Vestas – 3 MW | 2010 | [16] |
VE Zelengrad | 42 | 110 | 14 × Vestas – 3 MW | 2014 | [17] |
VE Ogorje | 42 | 100 | 14 × Vestas – 3 MW | 2015 | [18] |
VE Kamensko-Voštane | 40 | 114 | 14 × Siemens – 3 MW | 2013 | [19] |
VE Bruška | 36.8 | 122 | 16 × Siemens – 2.3 MW | 2011 | [20] |
VE Ponikve | 36.8 | 122 | 16 × Enercon – 2.3 MW | 2012 | [21] |
VE Rudine | 34.2 | 85 | 12 × GE Energy – 2.85 MW | 2015 | [22] |
VE Katuni | 34.2 | 95 | 12 × GE Energy – 2.85 MW | 2016 | [23] |
VE Ljubač | 32.4 | 96 | 9 x Nordex – 3.6 MW | 2022 | [24] |
VE Jelinak | 30 | 81 | 20 × Acciona – 1.5 MW | 2013 | [25] |
VE Glunča | 20.7 | 53 | 9 x Enercon – 2.3 MW | 2016 | [26] |
VE Pometeno brdo | 20 | 50 | 15 × Končar – 1 MW 2 × Končar – 2.5 MW | 2015 | [27] |
VE Jasenice | 11.5 | 44 | 5 x Enercon – 2.3 MW | 2020 | [28] |
VE Trtar-Krtolin | 11.2 | 28 | 14 × Enercon – 0.8 MW | 2007 | [29] |
VE Crno brdo | 10.5 | 27 | 7 × Leitwind – 1.5 MW | 2011 | [30] |
VE Orlice | 9.6 | 25 | 3 x Enercon – 0.8 MW 8 x Enercon – 0.9 MW | 2009 | [31] |
VE Velika Popina | 9.2 | 26 | 4 × Siemens – 2.3 MW | 2011 | [32] |
VE Zadar 4 | 9.2 | 30 | 4 × Siemens – 2.3 MW | 2013 | [33] |
VE Ravne 1 | 5.95 | 15 | 7 × Vestas – 0.85 MW | 2004 | [34] |
In total | 970.15 | 2,838 | 364 | 2004–2022 | |
Renewable energy progress in the European Union (EU) is driven by the European Commission's 2023 revision of the Renewable Energy Directive, which raises the EU's binding renewable energy target for 2030 to at least 42.5%, up from the previous target of 32%. Effective since November 20, 2023, across all EU countries, this directive aligns with broader climate objectives, including reducing greenhouse gas emissions by at least 55% by 2030 and achieving climate neutrality by 2050. Additionally, the Energy 2020 strategy exceeded its goals, with the EU achieving a 22.1% share of renewable energy in 2020, surpassing the 20% target.
The United Kingdom is the best location for wind power in Europe and one of the best in the world. The combination of long coastline, shallow water and strong winds make offshore wind unusually effective.
Wind power, a form of renewable energy harnessed through wind turbines, stands as a pivotal contributor to Australia's energy landscape. With a total installed wind capacity reaching approximately 9,100 megawatts (MW) as of October 2023, wind power constitutes a significant portion, representing 5% of Australia's total primary energy supply and a substantial 35% of its renewable energy supply. Australia's geographic disposition favours the proliferation of wind energy infrastructure, particularly in the southern regions of the nation and along the slopes of the Great Dividing Range in the east. Approximately half of Australia's wind farms are located near coastal regions.
Solar power is a major contributor to electricity supply in Australia. As of December 2023, Australia's over 3.69 million solar PV installations had a combined capacity of 34.2 GW photovoltaic (PV) solar power. In 2019, 59 solar PV projects with a combined capacity of 2,881 MW were either under construction, constructed or due to start construction having reached financial closure. Solar accounted for 12.4% of Australia's total electrical energy production in 2021.
As of 2023, Europe had a total installed wind capacity of 255 gigawatts (GW). In 2017, a total of 15,680 MW of wind power was installed, representing 55% of all new power capacity, and the wind power generated 336 TWh of electricity, enough to supply 11.6% of the EU's electricity consumption.
Wind power generation capacity in India has significantly increased in recent years. As of 31 March 2024, the total installed wind power capacity was 45.887 gigawatts (GW). India has the fourth largest installed wind power capacity in the world. Wind power capacity is mainly spread across the southern, western, and northwestern states. The onshore wind power potential of India was assessed at 132 GW with minimum 32% CUF at 120 m above the local ground level (agl). Whereas, the estimated potential at minimum 25% CUF is 695 GW at 120 agl.
Wind power in Texas, a portion of total energy in Texas, consists of over 150 wind farms, which together have a total nameplate capacity of over 30,000 MW. If Texas were a country, it would rank fifth in the world: The installed wind capacity in Texas exceeds installed wind capacity in all countries but China, the United States, Germany and India. Texas produces the most wind power of any U.S. state. According to the Electric Reliability Council of Texas (ERCOT), wind power accounted for at least 15.7% of the electricity generated in Texas during 2017, as wind was 17.4% of electricity generated in ERCOT, which manages 90% of Texas's power. ERCOT set a new wind output record of nearly 19.7 GW at 7:19 pm Central Standard Time on Monday, January 21, 2019.
Wind power in California had initiative and early development during Governor Jerry Brown's first two terms in the late 1970s and early 1980s. The state's wind power capacity has grown by nearly 350% since 2001, when it was less than 1,700 MW. In 2016, wind energy supplied about 6.9% of California's total electricity needs, or enough to power more than 1.3 million households. Most of California's wind generation is found in the Tehachapi area of Kern County, California, with some large projects in Solano, Contra Costa and Riverside counties as well. California is among the states with the largest amount of installed wind power capacity. In recent years, California has lagged behind other states when it comes to the installation of wind power. It was ranked 4th overall for wind power electrical generation at the end of 2016 behind Texas, Iowa, and Oklahoma. As of 2019, California had 5,973 megawatts (MW) of wind power generating capacity installed.
Wind power is the fastest-growing renewable energy technology in Scotland, with 11,482 megawatts (MW) of installed wind power capacity by Q1 2023. This included 9,316 MW from onshore wind in Scotland and 2,166 MW of offshore wind generators.
India is the world's 4th largest consumer of electricity and the world's 3rd largest renewable energy producer with 40% of energy capacity installed in the year 2022 coming from renewable sources. Ernst & Young's (EY) 2021 Renewable Energy Country Attractiveness Index (RECAI) ranked India 3rd behind USA and China. In FY2023-24, India is planning to issue 50 GW tenders for wind, solar and hybrid projects. India has committed for a goal of 500 GW renewable energy capacity by 2030. In line with this commitment, India's installed renewable energy capacity has been experiencing a steady upward trend. From 94.4 GW in 2021, the capacity has gone up to 119.1 GW in 2023 as of Q4.
Wind power in Illinois provided nearly 10% of the state's generated electrical power in 2020 powering 1,231,900 homes. At the end of 2020, Illinois had 6,300 megawatts (MW) of wind power installed, ranking fifth among states for installed wind turbine capacity. An additional 1,100 MW of wind power was under construction across the state at the end of 2020.
Energy in Croatia describes energy and electricity production, consumption and import in Croatia.
In Japan's electricity sector, wind power generates a small proportion of the country's electricity. It has been estimated that Japan has the potential for 144 gigawatts (GW) for onshore wind and 608 GW of offshore wind capacity. As of 2023, the country had a total installed capacity of 5.2 GW.
Solar power generated 12% of Bulgaria’s electricity in 2023.
The U.S. State of Oklahoma has high potential capacity for wind power in the western half of the state. In 2021, Oklahoma's installed wind generation capacity was almost 10,500 megawatts, supplying over 40% of the state's generated electricity and 85% of Oklahoma's total generating capacity from all renewable resources.
As of the end of 2021, New Mexico had 4,001 megawatts (MW) of wind powered electricity generating capacity, responsible for 30% of electricity produced that year. Wind power in New Mexico has the potential to generate more than all of the electricity consumed in the state.
Wind power in Hawaii is produced by the state's 132 commercial wind turbines, totaling 236 MW in capacity. In 2015, wind turbines produced 6.4% of Hawaii's electricity. In 2012, Hawaii generated 367 million kWh from wind power.
The East Anglia Array is a proposed series of offshore wind farms located around 30 miles off the east coast of East Anglia, in the North Sea, England. It has begun with the currently operational East Anglia ONE, that has been developed in partnership by ScottishPower Renewables and Vattenfall. Up to six individual projects could be set up in the area with a maximum capacity of up to 7.2 GW. The first project, East Anglia ONE at 714 MW, received planning consent in June 2014 and contracts in April 2016. Offshore construction began in 2018 and the project was commissioned in July 2020. It is expected to cost £2.5 billion.
Wind power in Wisconsin started in 1990 with the installation of the Lincoln Turbines wind farm, and contributes to the state's renewable portfolio standard established in 1998. In 2016, Wisconsin had a wind generating capacity of 648 megawatts (MW), responsible for generating 2.4% of its electricity. In 2019, this increased to a capacity of 737 MW, and a 2.63% of generation.
Under the original 2009 Renewable Energy Directive Ireland had set a target of producing 16% of all its energy needs from renewable energy sources by 2020 but that has been updated by a second Renewable Energy Directive whose targets are 32% by 2030. Between 2005 and 2014 the percentage of energy from renewable energy sources grew from just 3.1% to 8.6% of total final consumption. By 2020 the overall renewable energy share was 13.5%, short of its Renewable Energy Drive target of 16%. Renewable electricity accounted for 69% of all renewable energy used in 2020, up from two thirds (66.8%) in 2019.